
IRVINE, Calif.--(BUSINESS WIRE)--
CoreLogic® (NYSE: CLGX), a leading global property information, analytics and data-enabled solutions provider, has conducted an analysis for the flooding occurring as a result of Hurricane Harvey. This analysis shows that 52 percent of residential and commercial properties in the Houston metro are at “High” or “Moderate” risk of flooding, but are not in a Special Flood Hazard Area (SFHA) as identified by the Federal Emergency Management Agency (FEMA). Properties within SFHA zones, categorized as Extreme or Very High risk, require flood insurance if the property has a federally insured mortgage. Properties outside SFHA zones are not required to carry flood insurance.
This Smart News Release features multimedia. View the full release here: http://www.businesswire.com/news/home/20170828005509/en/
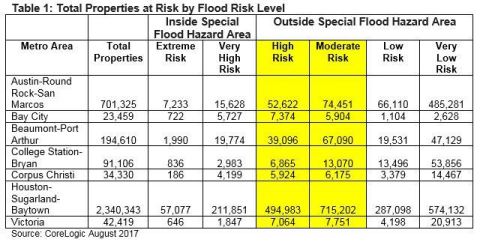
CoreLogic Table 1: Total Properties at Risk by Flood Risk Level (Graphic: CoreLogic)
Table 1 shows the levels of flood risk* according to CoreLogic data for
properties in seven metro areas likely to get severe rain and flooding
as a result of Hurricane Harvey. Table 2 shows only the total and
percent of properties in the High and Moderate risk categories that are
not in an SFHA and therefore not required to carry flood insurance.
|
Table 1: Total Properties at Risk by Flood Risk Level |
||||||||||||||||||||||
|
Inside Special |
Outside Special Flood Hazard Area | |||||||||||||||||||||
| Metro Area |
Total |
Extreme |
Very |
High |
Moderate |
Low |
Very |
|||||||||||||||
|
Austin-Round |
701,325 | 7,233 | 15,628 |
52,622 |
74,451 |
66,110 | 485,281 | |||||||||||||||
|
Bay City |
23,459 | 722 | 5,727 |
7,374 |
5,904 |
1,104 | 2,628 | |||||||||||||||
|
Beaumont-Port |
194,610 | 1,990 | 19,774 |
39,096 |
67,090 |
19,531 | 47,129 | |||||||||||||||
|
College Station- |
91,106 | 836 | 2,983 |
6,865 |
13,070 |
13,496 | 53,856 | |||||||||||||||
|
Corpus Christi |
34,330 | 186 | 4,199 |
5,924 |
6,175 |
3,379 | 14,467 | |||||||||||||||
|
Houston- |
2,340,343 | 57,077 | 211,851 |
494,983 |
715,202 |
287,098 | 574,132 | |||||||||||||||
|
Victoria |
42,419 | 646 | 1,847 |
7,064 |
7,751 |
4,198 | 20,913 | |||||||||||||||
|
Source: CoreLogic August 2017 |
||||||||||||||||||||||
|
Table 2: Total Properties in the High/Moderate Risk Level |
||||||||||
|
|
Outside Special Flood Hazard Area
|
|||||||||
| Metro Area | Total Properties |
Total Properties in |
Percentage of |
|||||||
|
Austin-Round Rock- |
701,325 |
127,073 |
18% | |||||||
|
Bay City |
23,459 |
13,278 |
57% | |||||||
|
Beaumont-Port Arthur |
194,610 |
106,186 |
55% | |||||||
|
College Station-Bryan |
91,106 |
19,935 |
22% | |||||||
|
Corpus Christi |
34,330 |
12,099 |
35% | |||||||
|
Houston-Sugarland- |
2,340,343 |
1,210,185 |
52% | |||||||
|
Victoria |
42,419 |
14,815 |
35% | |||||||
|
Source: CoreLogic August 2017 |
||||||||||
*This current analysis does not include risk from storm surge or flash flooding.
About CoreLogic
CoreLogic (NYSE: CLGX) is a leading global
property information, analytics and data-enabled solutions provider. The
company’s combined data from public, contributory and proprietary
sources includes over 4.5 billion records spanning more than 50 years,
providing detailed coverage of property, mortgages and other
encumbrances, consumer credit, tenancy, location, hazard risk and
related performance information. The markets CoreLogic serves include
real estate and mortgage finance, insurance, capital markets, and the
public sector. CoreLogic delivers value to clients through unique data,
analytics, workflow technology, advisory and managed services. Clients
rely on CoreLogic to help identify and manage growth opportunities,
improve performance and mitigate risk. Headquartered in Irvine, Calif.,
CoreLogic operates in North America, Western Europe and Asia Pacific.
For more information, please visit www.corelogic.com.
CORELOGIC and the CoreLogic logo are trademarks of CoreLogic, Inc. and/or its subsidiaries.
View source version on businesswire.com: http://www.businesswire.com/news/home/20170828005509/en/

