$NZDUSD Elliott Waves forecasting the decline
At the begining of September 2016 $NZDUSD reached daily extreme area at 0.7389-0.7557 and our view was suggesting potential pull back in 3 waves against the January 20th low at least. The pair found sellers at the mentioned technical area and made top on September 7th ( 0.74882 peak) and since then it traded lower. In this technical blog we’re going to take a quick look at past h1 EWF’s charts of NZDUSD, to see how we guide our members through this currency pair.
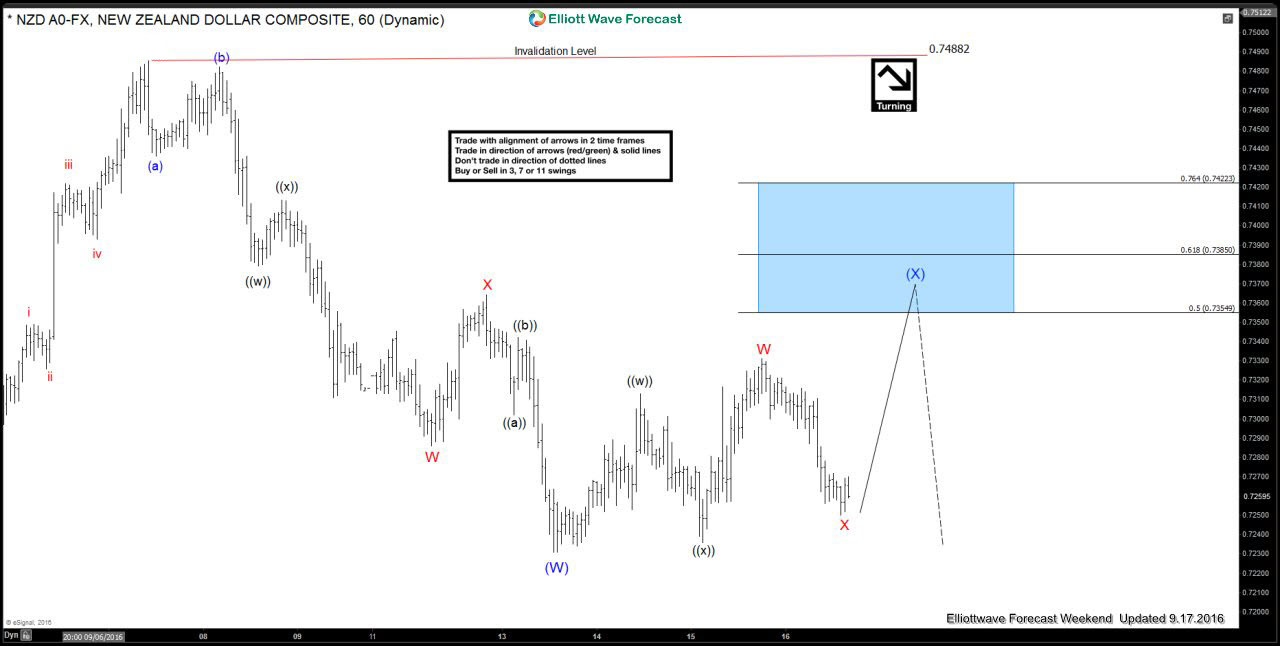
$NZDUSD Weekend Update 9.17.2016 Our Elliott wave chart suggested that pair is doing (X) blue recovery against the 0.74882 peak with potential to make double WXY red toward 50-61.8 fibs zone : 0.73549-0.7385 area, where sellers will be waiting for further decline.
Find the full article in the pdf below...

Elliottwave-Forecast.com (by EME PROCESSING AND CONSULTING LLC) was founded in 2005 by Eric Morera. Since inception our company has provided tailored Financial Market Services to thousands of clients. ElliottWave-Forecast has built a reputation on accurate technical analysis and a winning attitude. By successfully incorporating the Elliott Wave Theory with Market Correlation, Cycles, Proprietary Pivot System, we provide precise forecasts with up-to-date analysis for 52 instruments including FX majors, Gold, Silver, Copper, Oil, TNX and major Equity Indices. Our clients also have immediate access to our proprietary Actionable Trade Setups, Market Overview, 1 Hour, 4 Hour, Daily & Weekly Wave Counts. Weekend Webinar, Live Screen Sharing Sessions, Daily Technical Videos, Educational Resources, and 24 Hour chat room where they are provided live updates and given answers to their questions.
Unfortunately, this report is not available for the investor type or country you selected.
Browse all ResearchPool reportsReport is subscription only.
Thank you, your report is ready.
Thank you, your report is ready.