$XAUGBP (Gold/Gbp) Elliott Wave Analysis
​XAUGBP (Gold/GBP) rallied from 2008 low to 2011 peak in 7 swings after it started correcting the cycle from 2008 low which lasted 4 years and ended in July 2015 at 61.8 Fibonacci retracement of the rally from 2008 low to 2011 peak. Since then instrument has rallied again in 7 swings to 1069 (July 2016). We have not yet seen a break of 2011 peak which is needed to negate another extension lower within the correction and to confirm that next leg higher has started but we notice that XAUAUD (Gold/AUD) has already broken above 2011 peak which suggests Gold against GBP is lagging and should also continue to break above 2011 peak.
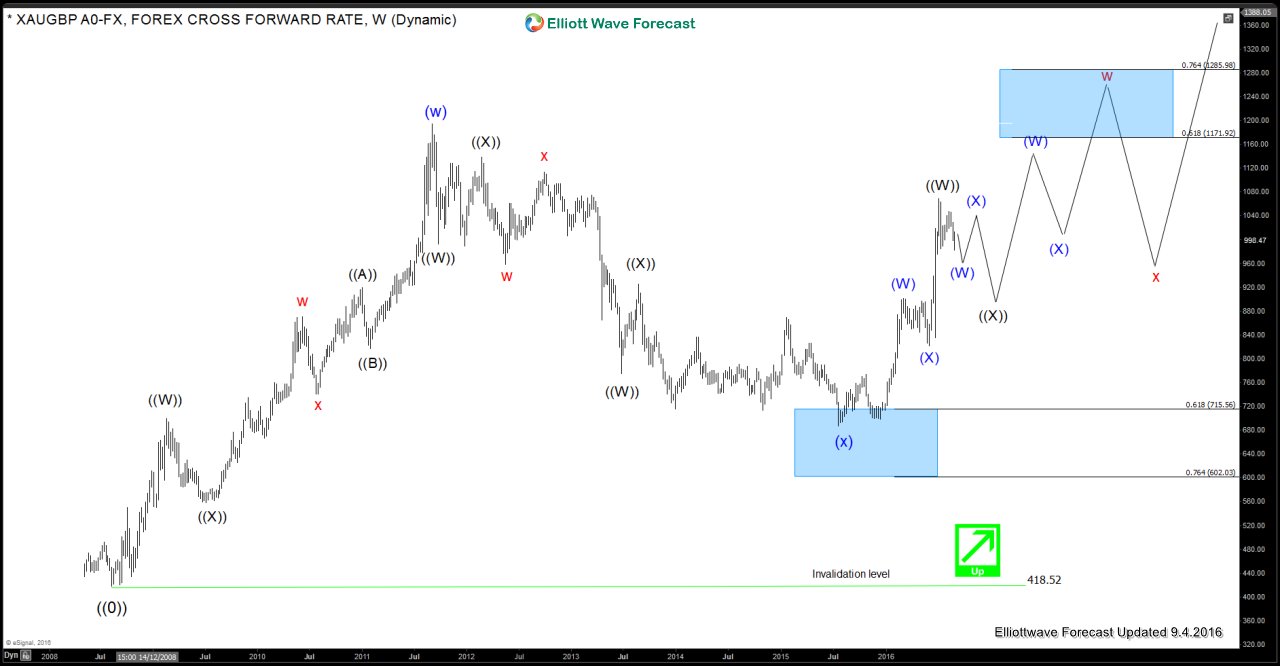
XAUGBP (Gold/GBP) Weekly Elliott Wave Chart
XAUGBP (Gold / GBP) Weekly Elliott Wave Chart (Alternate view)

XAUAUD Weekly chart showing break of 2011 peak
XAUAUD Weekly chart shows instrument has broken above 2011 peak and is now showing an incomplete bullish sequence from 2008 low which means XAUGBP will most likely follow and break above 2011 peak as far as XAUGBP dips remain above July 2015 low.

XAUGBP (Gold/GBP) Daily Elliott Wave chart
Metal is proposed to have ended a cycle from July 2015 low and should now ideally pull back in 7 swings before rally resumes towards 1171 – 1285 area initially followed by 1470 – 1654 region. This view will remain valid as far as pivot at July 2015 low remains intact. Alternatively, wave (x) correction could have ended on 12/31/2013 low and XAUGBP could be doing a FLAT Elliott Wave structure from there. In either case, we believe 961 – 908 area would see buyers for a 3 wave bounce in wave (X) to fail below 1069 and another extension lower in wave (Y) of ((X)) or take the metal to new highs above 1069 to complete a FLAT structure from 12/31/2013 low before making a larger pull back to correct cycle from 12/31/2013 low.

We hope you enjoyed this article about XAUGBP (Gold/GBP). If you want to see our preferred Elliott wave Analysis in XAUAUD (Gold /AUD), you can check out our last update here.
In order to see our preferred Elliott Wave Analysis for Gold, Silver, Copper, Oil, Natural Gas and 52 instruments in total, Sign up for your Free 14 day Trial or visit Video Blog , Technical Blog or Chart of the day sections of our website for more free analysis and articles.

Elliottwave-Forecast.com (by EME PROCESSING AND CONSULTING LLC) was founded in 2005 by Eric Morera. Since inception our company has provided tailored Financial Market Services to thousands of clients. ElliottWave-Forecast has built a reputation on accurate technical analysis and a winning attitude. By successfully incorporating the Elliott Wave Theory with Market Correlation, Cycles, Proprietary Pivot System, we provide precise forecasts with up-to-date analysis for 52 instruments including FX majors, Gold, Silver, Copper, Oil, TNX and major Equity Indices. Our clients also have immediate access to our proprietary Actionable Trade Setups, Market Overview, 1 Hour, 4 Hour, Daily & Weekly Wave Counts. Weekend Webinar, Live Screen Sharing Sessions, Daily Technical Videos, Educational Resources, and 24 Hour chat room where they are provided live updates and given answers to their questions.
Unfortunately, this report is not available for the investor type or country you selected.
Browse all ResearchPool reportsReport is subscription only.
Thank you, your report is ready.
Thank you, your report is ready.