AAPL reached first target area at 128.
Hello fellow traders. In this technical blog we’re going to take a quick look at the past Elliott Wave charts of Apple ( AAPL) published in members area of www.elliottwave-forecast.com. We’re going to explain the structure and see how we guided our members through this instrument.
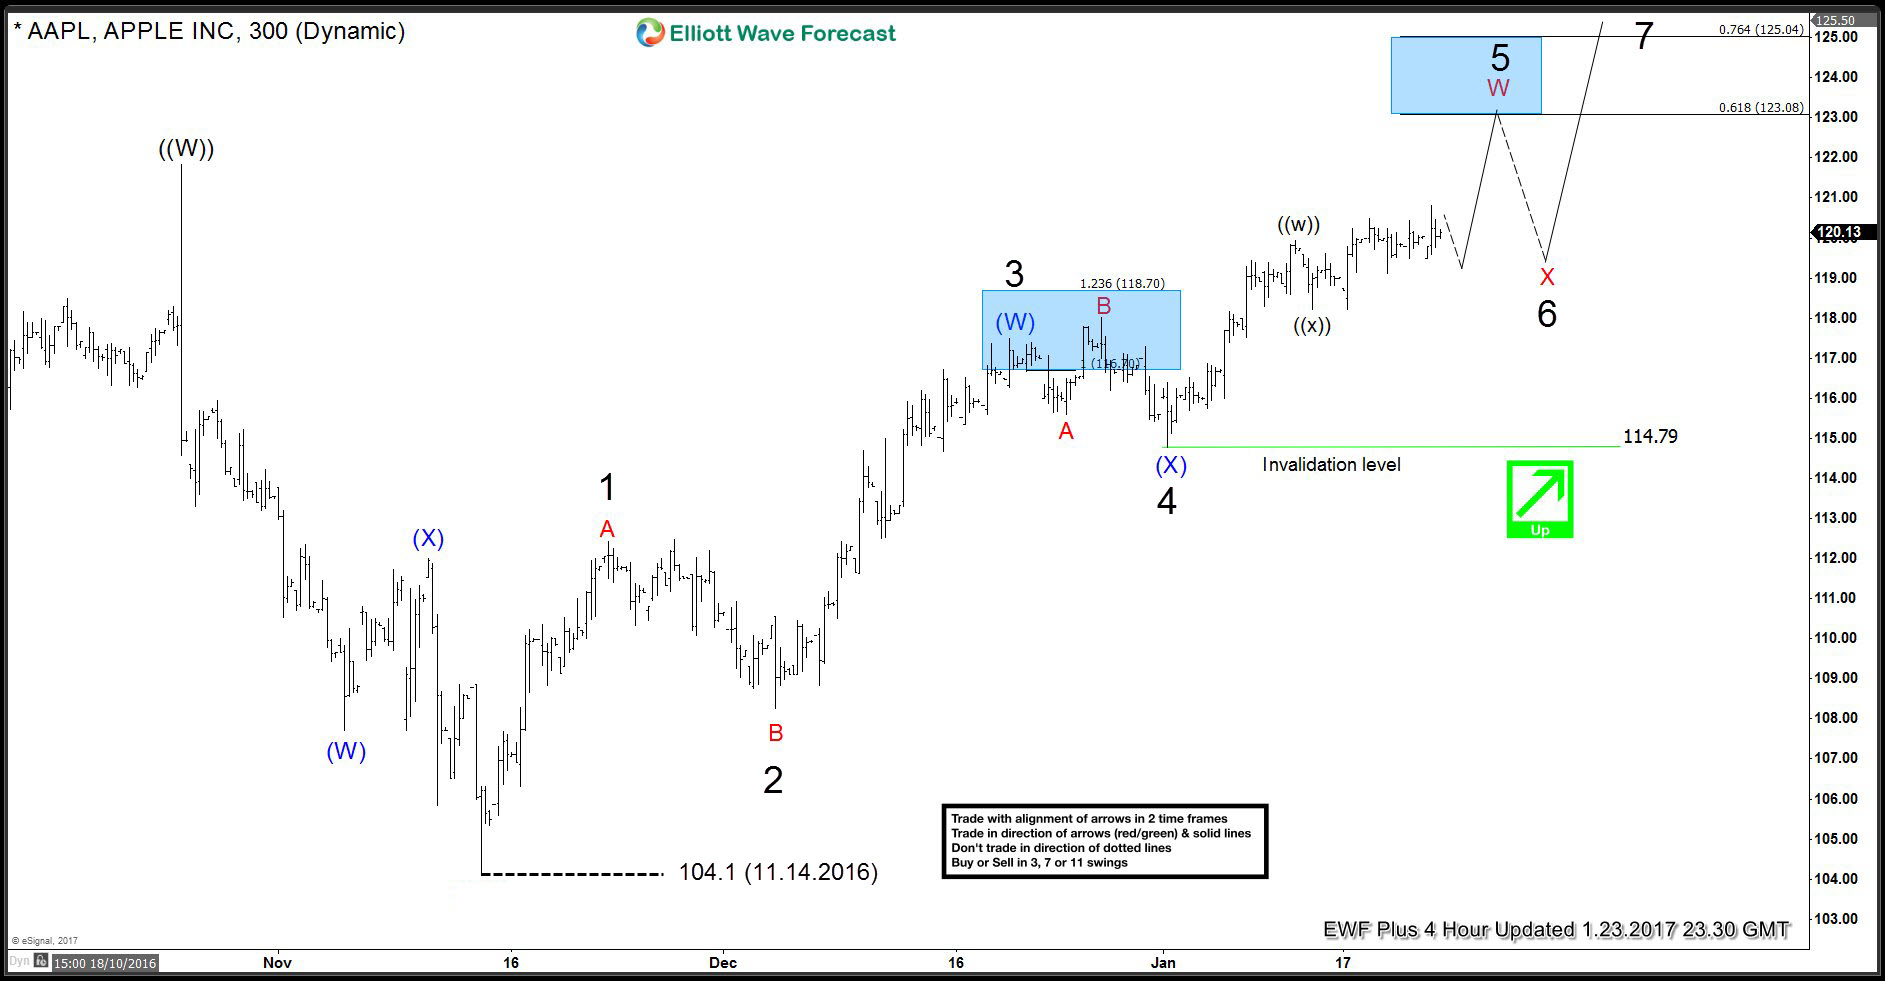
AAPL 4 Hour update 01.23.2017
Price structure is showing incomplete bullish sequences in the cycle from the 11.14 (104.1) low. We’re having 5 swings up from the mentioned level, suggesting more upside while 114.79 pivot holds. 5th swing is still in progress toward 123.08-125.04 area, from where it can pull back before main target is reached. Main target for the 7th swings up comes at equal legs area (W)-(X): 128.16-131.34 . We advise our members to avoid selling the stock, and keep buying the dips in 3,7,11 swings.
Now let’s take a look at the short term structures.
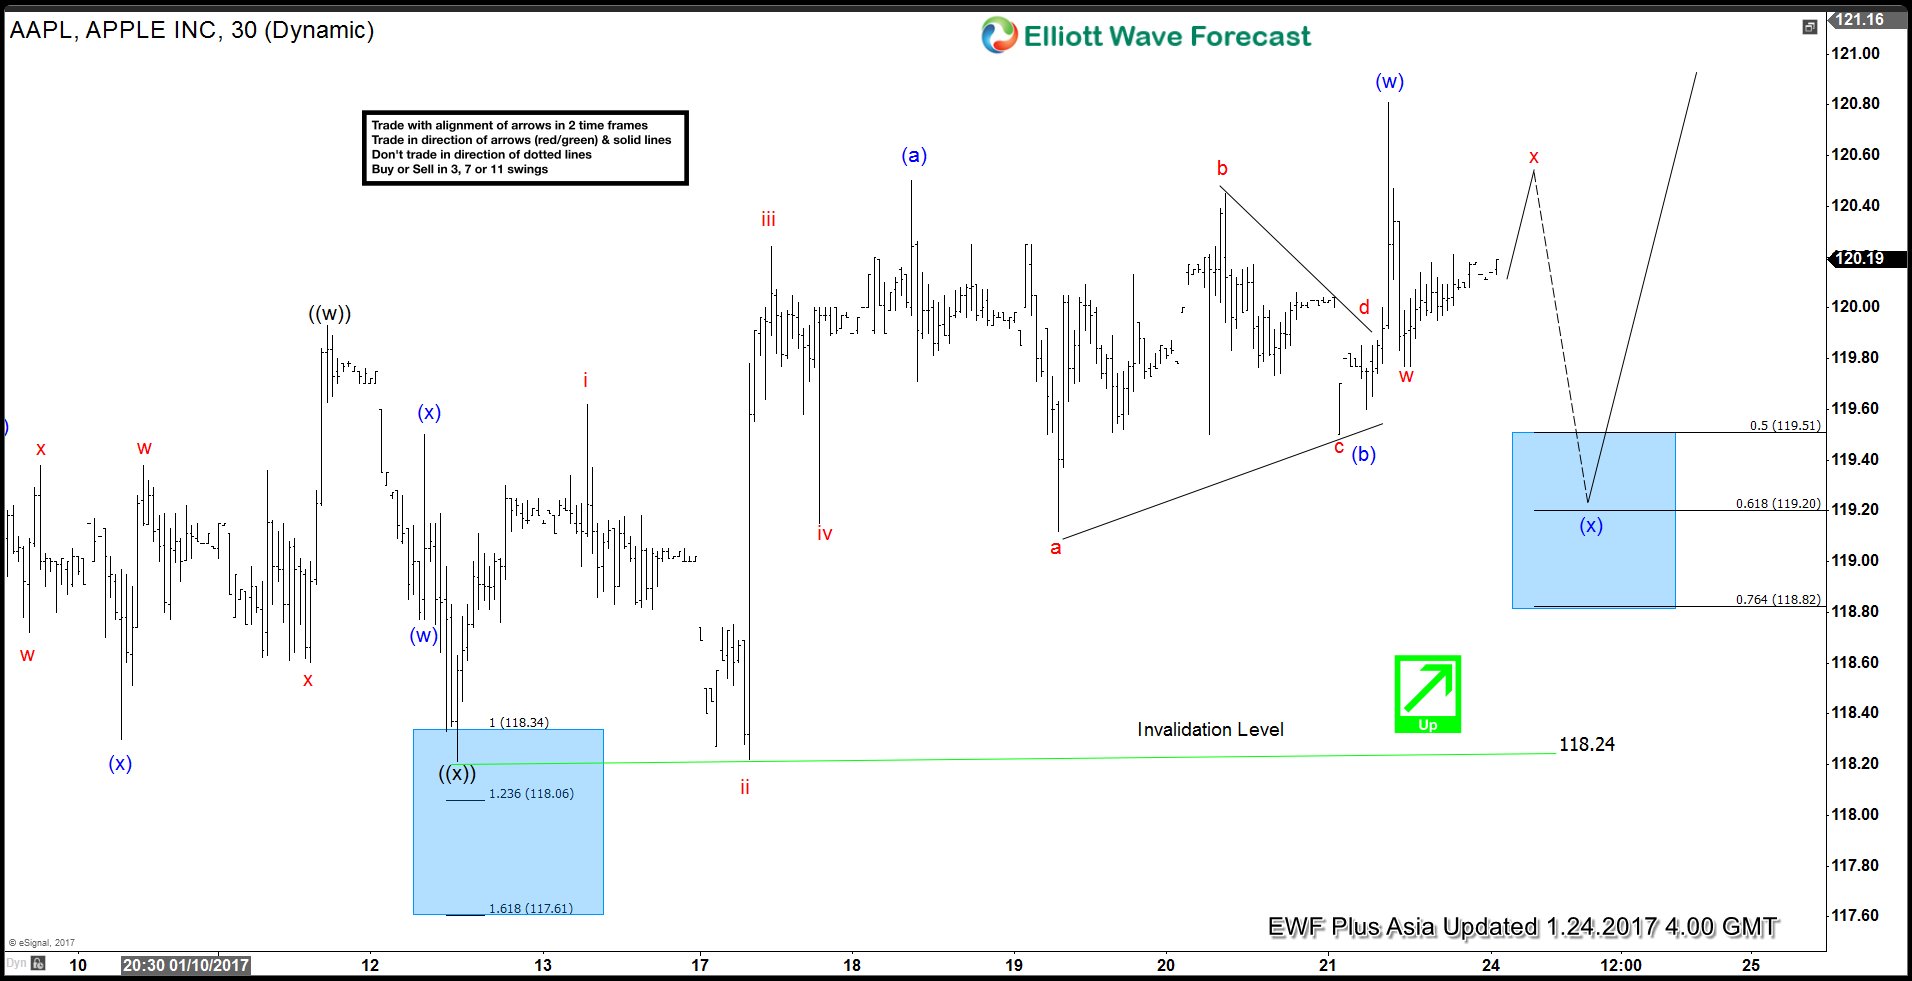
AAPL h1 update, 01.24.2017 The current price structure suggests we’re correcting short term cycle from the 118.24 low. Pull back is expected to reach 50-76.4 fibonacci zone :119.51-118.82 ( buying zone) before further rally takes place
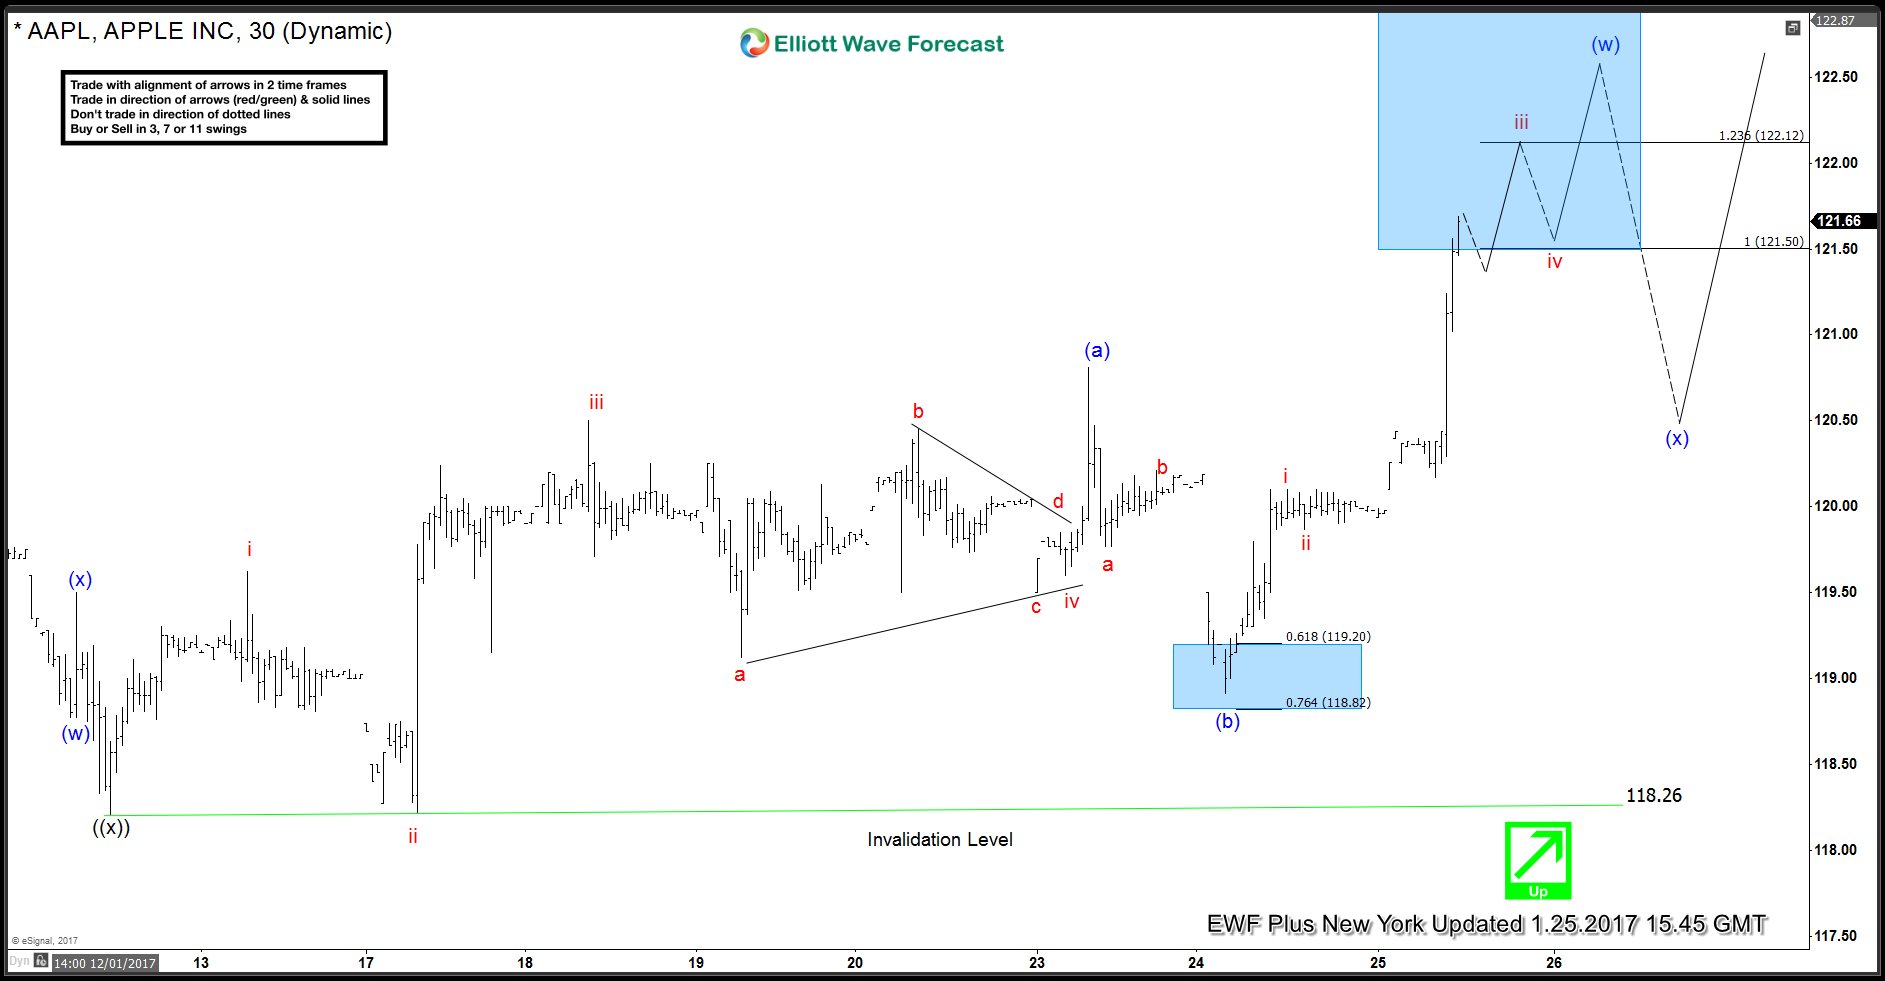
AAPL h1 update, 01.25.2017 Pull back (x) blue reached proposed buying zone and made nice reaction from there. The stock remains bullish against the 118.26 low . We favor more upside, targeting 123.08-125.04 area next, and eventualy 128.16-131.34 ( main target).
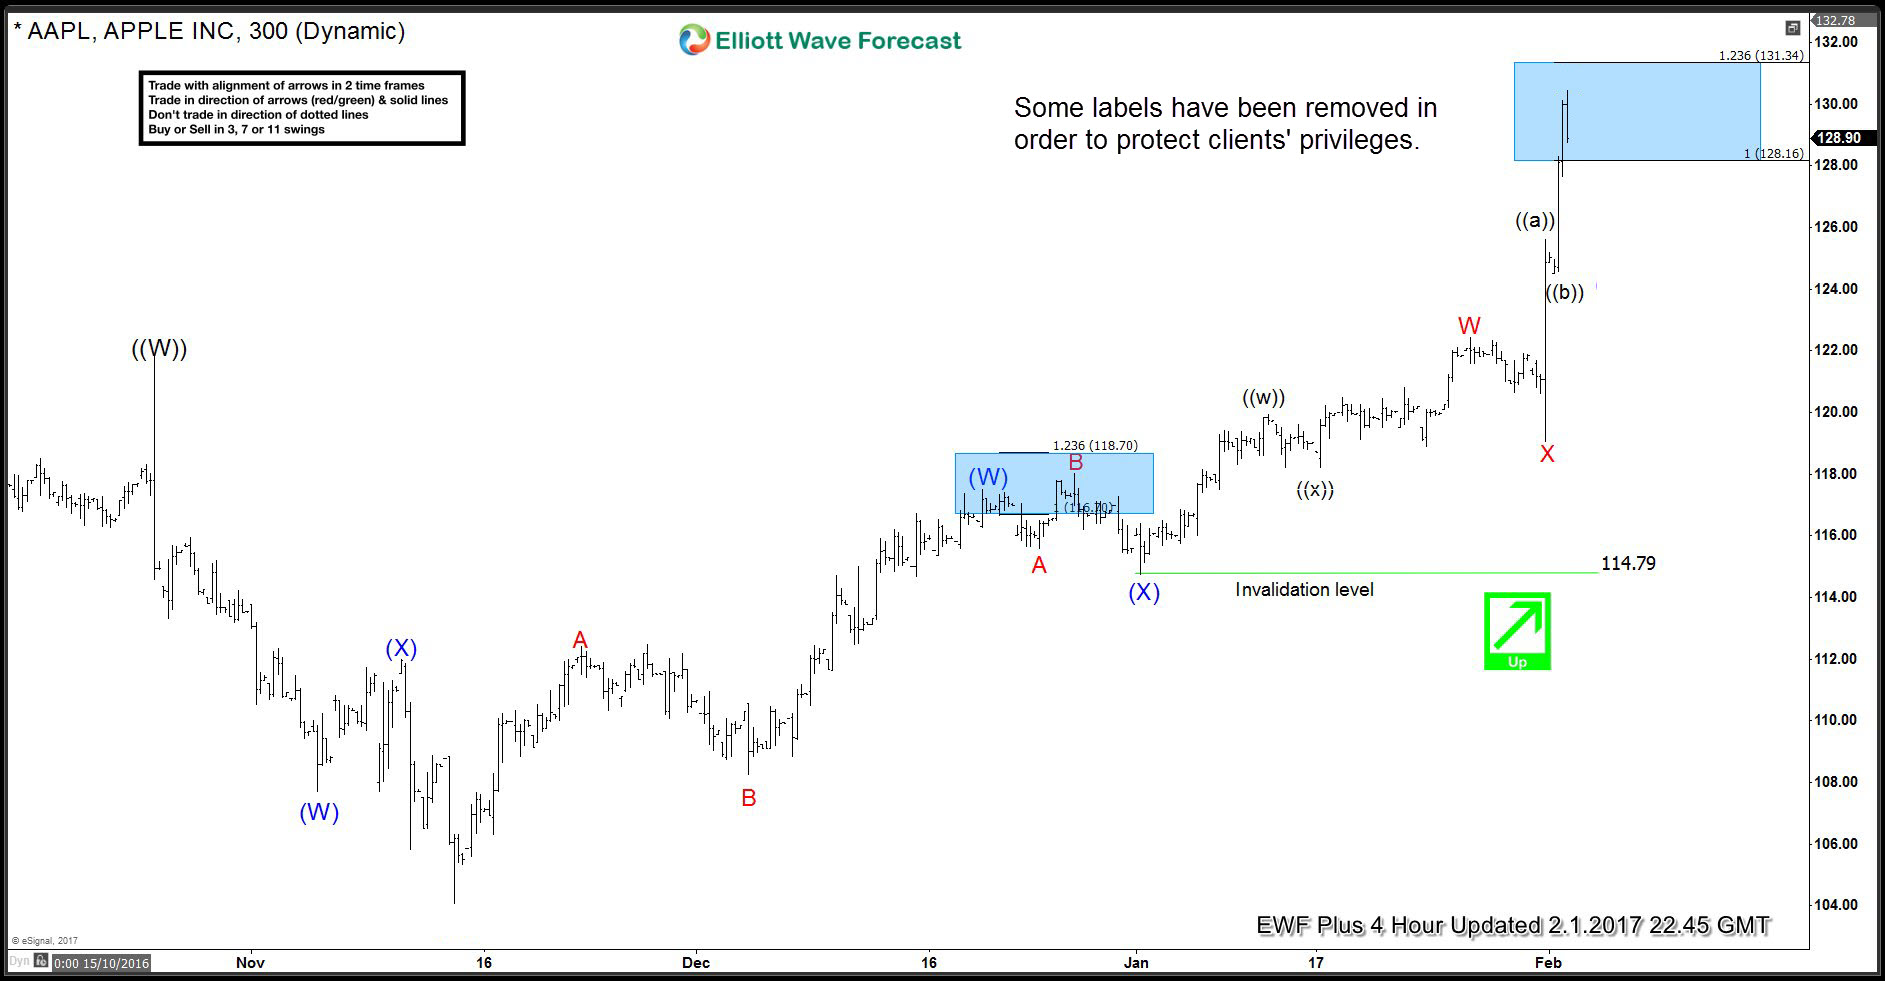
AAPL h4 update, 02.01.2017
The price has reached the main target at 128.16-131.34, and now Apple is about to complete 7th swing from the 11.14 low. Note: we removed some labeles from the chart in order to protect client’s privileges. Future path of Apple (AAPL) can be found in the membership area of EWF. ( If not a member yet, you have opportunity to take 14 Days Free Trial )
Through time we have developed a very respectable trading strategy which defines Entry, Stop Loss and Take Profit levels with high accuracy and allows you to make position Risk Free, shortly after taking it. If you want to learn all about it and become a professional Trader, join us now for Free.


Elliottwave-Forecast.com (by EME PROCESSING AND CONSULTING LLC) was founded in 2005 by Eric Morera. Since inception our company has provided tailored Financial Market Services to thousands of clients. ElliottWave-Forecast has built a reputation on accurate technical analysis and a winning attitude. By successfully incorporating the Elliott Wave Theory with Market Correlation, Cycles, Proprietary Pivot System, we provide precise forecasts with up-to-date analysis for 52 instruments including FX majors, Gold, Silver, Copper, Oil, TNX and major Equity Indices. Our clients also have immediate access to our proprietary Actionable Trade Setups, Market Overview, 1 Hour, 4 Hour, Daily & Weekly Wave Counts. Weekend Webinar, Live Screen Sharing Sessions, Daily Technical Videos, Educational Resources, and 24 Hour chat room where they are provided live updates and given answers to their questions.
Unfortunately, this report is not available for the investor type or country you selected.
Browse all ResearchPool reportsReport is subscription only.
Thank you, your report is ready.
Thank you, your report is ready.