DeutscheBank Elliott Wave Analysis Still Calling Higher February 20, 2017
In September 2016 , the media was calling for the collapse of DeutscheBank as its shares were dropping to new all time lows and Investors were worried about another financial crisis . However in our previous article , we were expecting a recovery for Deutsche Bank stock as the technical picture was pointing to an ending diagonal taking place to finish at least the cycle from 03/14/2016 peak and start a short term bounce .
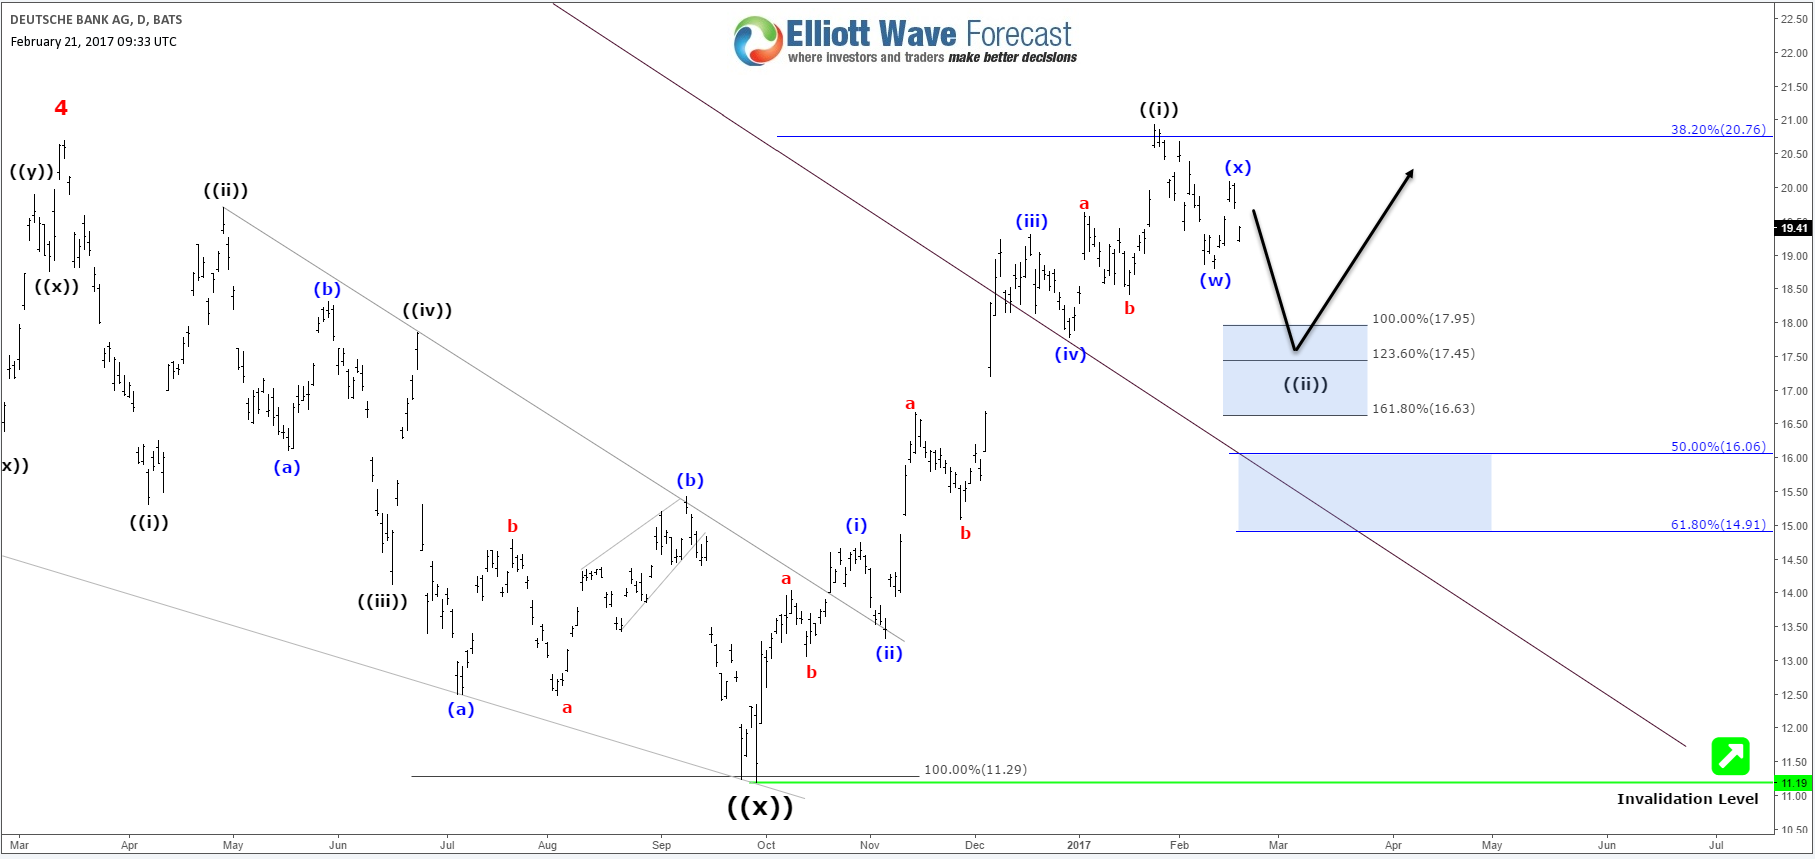
In the recent 4 months , DeutscheBank stock (DB:NYSE) managed to do an impressive +90% run tearing apart theories about its crash and reaching our first target of the recovery at the 38.2% Fibonacci area $20.76 . The move from September 2016 low can be labeled as 5 waves leading diagonal Elliott Wave structure which currently ended at 01/25/2017 peak and could be the first leg of an impulsive move or just wave A of a Zigzag Elliott Wave structure .
As the stock was expected to correct the cycles from the lows , then a double three correction was put in place for the pullback to happen with the first inflection area coming at equal legs $18.83 – $18.45 where DB can resume higher or bounce in 3 waves at least .

DeutscheBank bounced from the mentioned area and held below 01/25 peak , so as long as $20.94 stays intact then DB will be looking to make the double correction toward equal legs area $17.95 – $17.45 where buyers are expected to show up for at least a 3 waves bounce . The 50% – 61.8% area of the rally comes at $16.06 – $14.91 which can be in play if the next bounce fail below the previous peak .
DeutscheBank Recap :
Deutsche Bank ended both 2014 & 2015 downside cycles and currently still aiming for higher levels in the recovery. The short term technical analysis for the stock using Elliott Wave Theory is supporting a bullish move to the upside after ending the current pullback which doesn’t need to make the double correction as it already made 3 swings lower and could resume higher from current levels .
If you enjoyed this article, feel free to navigate to our Technical Blog and also check our Chart of The Day .
For further information on how to trade forex, indices, commodities and stocks using Elliott Wave Theory , try us 14 days for FREE . You will get access to our Professional Elliott Wave analysis in 4 different time frames, Daily Elliott Wave Setup Videos , Live Trading Room and 2 Live Analysis Session done by our Expert Analysts every day, 24 hour chat room support, Weekly Technical videos and much more so if you are not a member yet, use this opportunity and sign up to get your FREE trial .


Elliottwave-Forecast.com (by EME PROCESSING AND CONSULTING LLC) was founded in 2005 by Eric Morera. Since inception our company has provided tailored Financial Market Services to thousands of clients. ElliottWave-Forecast has built a reputation on accurate technical analysis and a winning attitude. By successfully incorporating the Elliott Wave Theory with Market Correlation, Cycles, Proprietary Pivot System, we provide precise forecasts with up-to-date analysis for 52 instruments including FX majors, Gold, Silver, Copper, Oil, TNX and major Equity Indices. Our clients also have immediate access to our proprietary Actionable Trade Setups, Market Overview, 1 Hour, 4 Hour, Daily & Weekly Wave Counts. Weekend Webinar, Live Screen Sharing Sessions, Daily Technical Videos, Educational Resources, and 24 Hour chat room where they are provided live updates and given answers to their questions.
Unfortunately, this report is not available for the investor type or country you selected.
Browse all ResearchPool reportsReport is subscription only.
Thank you, your report is ready.
Thank you, your report is ready.