Do you want Tesla shares (TSLA) in your Portfolio ?
Tesla Motors is an American automaker and energy storage specializing in electric cars and battery charging equipment . Its chairman Elon Musk who’s also CEO of SpaceX and Co-Founder of SolarCity , has said that he visualize Tesla Motors as a technology company and independent automaker, aimed at offering electric cars at prices affordable to the average consumer.
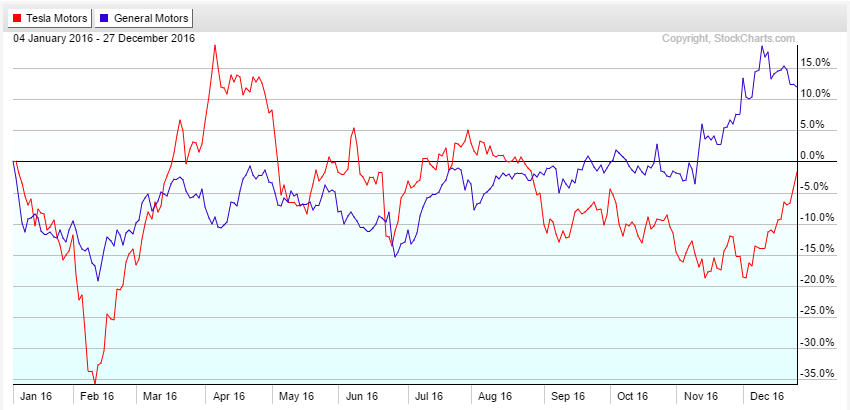
Tesla acquired SolarCity (NSDQ:SCTY) in November and with Tesla’s “Model 3″ electric care generating a record-breaking $10 billion worth of pre-orders in just 2 days , the company shares ( NASDAQ:TSLA ) managed to make a +20% move this month . However if we take a look at the year-to-date performance we find out that Tesla is still showing a negative number because of the deep move lower early this year , so if you compare it to the giant General Motors Company (NYSE:GM) you will make a conclusion that it was a better investment even with just a +12% gain this year .
Tesla Technical View
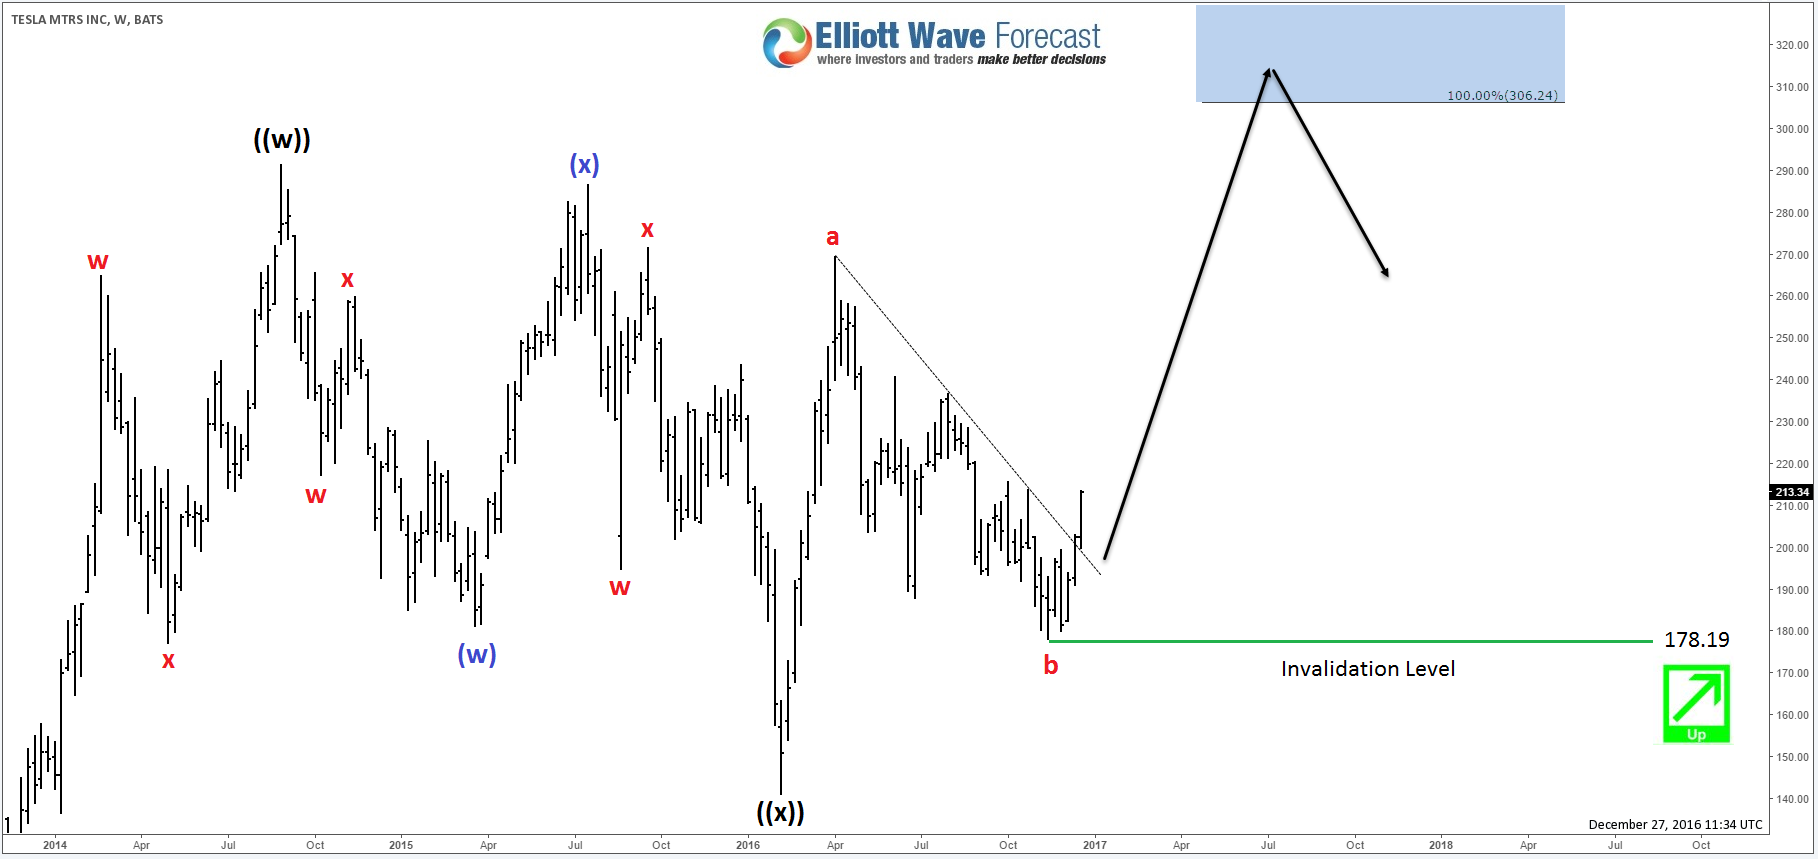
After going public more than 6 years ago, Tesla saw a massive +1500% gain as the stock rallied from $15 to a high of $291 in only 4 years . But since then the stock stayed trapped in a 100 dollar range between 180$ & $280 area , even with some spikes higher or lower, the price bounced several times from both ends and it still needs a clear breakout above this consolidation area to resume the move higher .

Elliott Wave Count
TSLA ended the correction from 2014 peak in wave ((x)) pullback after a dip in February 2016 and since then the stock is proposed to have resumed its uptrend move which needs a break above $291 to confirm the bullish sequence. Last week , the stock broke above the April trend-line meaning that wave b pullback , which missed its equal legs at $170, is done at $178.19 low so while the stock remains above that level it’s expected to trade higher looking for a first target around $306 area . Consequently, if you are interested in having Tesla in your portfolio , you should be looking for a buying opportunity in the shorter time cycles when the stock makes makes 3 , 7 or 11 swings pullbacks against the November low $178.19.
If you enjoyed this article, feel free to read other posts in our Technical Blog and also check out Chart of The Day . For further information on how to trade forex, indices, commodities and stocks using Elliott Wave technique , try us 14 days for FREE . You will get access to our Professional Elliott Wave analysis in 4 different time frames, Daily Elliott Wave Setup Videos , Live Trading Room and 2 Live Analysis Session done by our Expert Analysts every day, 24 hour chat room support, Weekly Technical videos and much more so if you are not a member yet, use this opportunity and sign up to get your FREE trial .

Elliottwave-Forecast.com (by EME PROCESSING AND CONSULTING LLC) was founded in 2005 by Eric Morera. Since inception our company has provided tailored Financial Market Services to thousands of clients. ElliottWave-Forecast has built a reputation on accurate technical analysis and a winning attitude. By successfully incorporating the Elliott Wave Theory with Market Correlation, Cycles, Proprietary Pivot System, we provide precise forecasts with up-to-date analysis for 52 instruments including FX majors, Gold, Silver, Copper, Oil, TNX and major Equity Indices. Our clients also have immediate access to our proprietary Actionable Trade Setups, Market Overview, 1 Hour, 4 Hour, Daily & Weekly Wave Counts. Weekend Webinar, Live Screen Sharing Sessions, Daily Technical Videos, Educational Resources, and 24 Hour chat room where they are provided live updates and given answers to their questions.
Unfortunately, this report is not available for the investor type or country you selected.
Browse all ResearchPool reportsReport is subscription only.
Thank you, your report is ready.
Thank you, your report is ready.