Don’t rush buying MasterCard (MA)
MasterCard shares (NYSE: MA) failed to break above the all-time highs made last month even with the “Trump Rally†which started 3 weeks ago pushing the stock market strongly to the upside , this doesn’t seems to had any impact on MasterCard so with investors looking to cash-out before Christmas and some stocks reaching extremes like American Express that could put pressure on the stock market which can see a healthy pullback .
The technical picture of MA is showing that the stock is doing 3 swings sequence from February lows which already reached its equal legs area at 108.05 and since then MA has been struggling to add new highs , it managed to pullback in 3 waves already which is generally enough to resume the trend but in this case MA still has the possibility to do a double three to correct the cycle from July low toward 50% – 61.8% Fibonacci area ( 97.75 – 95.12 ) which will provide buyers with another opportunity to go Long there meaning either new highs or just a 3 waves bounce .
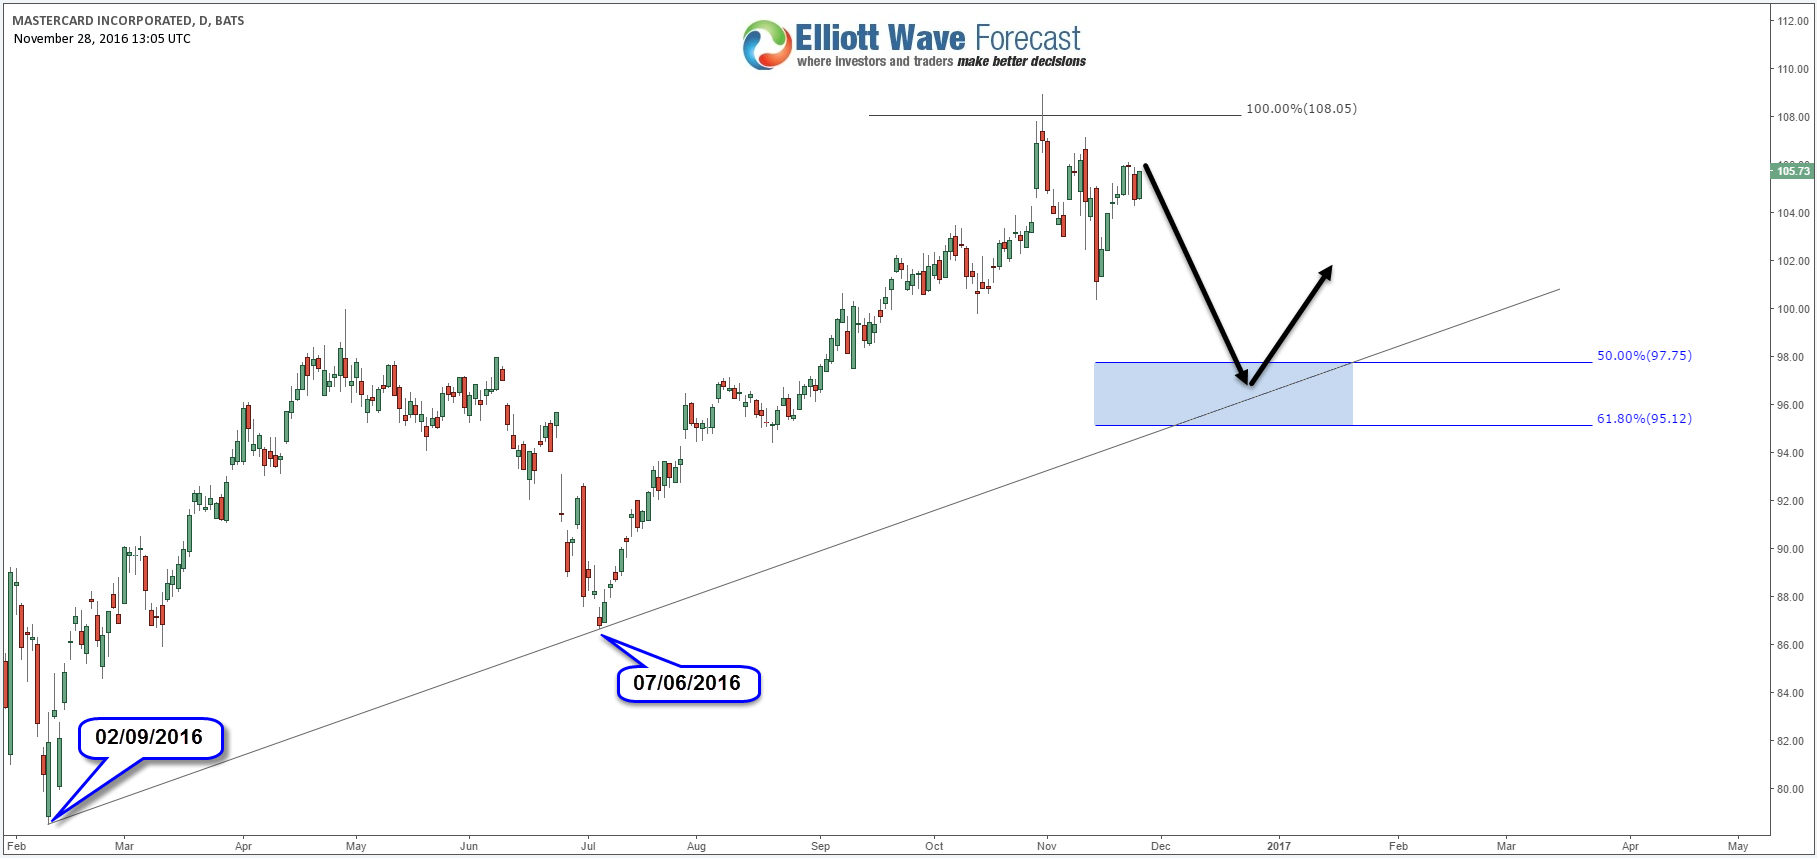
If MasterCard manage to hold July 2016 pivot in the pullback then the stock could be doing an ending Diagonal in wave (C) of a Flat from August 2015 low which means the last leg higher could reach 113 – 115 area or even extend further toward 120 before a larger pullback is seen .

If July 2016 pivot fails then the stock could extend lower to correct cycle from February 2016 low or August 2015 low meaning a deeper pullback to around 91.75 could be seen as a second wave (X) connector in a triple three structure from August 2015 low , in that case it will take a longer time before it can see new highs .

In both cases , MasterCard reached an extreme area ending 3 swings from 2015 & 2016 lows so even breaking the previous peak from current levels it’s not a good idea to chase Longs as cycles are mature and it’s better to wait for a clear structure pullback in 3 , 7 or 11 swings before buying the stock for another rally . Using Elliott Wave Theory can always provide you with different scenarios but combined with the right tool it can give you an edge to find the best trading opportunity .
For further information on how to find levels to trade forex, indices, and stocks using Elliott Wave and the 3 , 7 or 11 swings technique, try us FREE for 14 days. You will get access to Professional Elliott Wave analysis in 4 different time frames, Daily Elliott Wave Setup Videos , Live Trading Room and 2 live Analysis Session done by our Expert Analysts every day, 24 hour chat room support, market overview, weekly technical videos and much more so if you are not a member yet, use this opportunity and sign up to get your FREE trial . If you enjoyed this article, feel free to read other diversified articles at our Technical Blogs and also check Chart of The Day .

Elliottwave-Forecast.com (by EME PROCESSING AND CONSULTING LLC) was founded in 2005 by Eric Morera. Since inception our company has provided tailored Financial Market Services to thousands of clients. ElliottWave-Forecast has built a reputation on accurate technical analysis and a winning attitude. By successfully incorporating the Elliott Wave Theory with Market Correlation, Cycles, Proprietary Pivot System, we provide precise forecasts with up-to-date analysis for 52 instruments including FX majors, Gold, Silver, Copper, Oil, TNX and major Equity Indices. Our clients also have immediate access to our proprietary Actionable Trade Setups, Market Overview, 1 Hour, 4 Hour, Daily & Weekly Wave Counts. Weekend Webinar, Live Screen Sharing Sessions, Daily Technical Videos, Educational Resources, and 24 Hour chat room where they are provided live updates and given answers to their questions.
Unfortunately, this report is not available for the investor type or country you selected.
Browse all ResearchPool reportsReport is subscription only.
Thank you, your report is ready.
Thank you, your report is ready.