ES_F (S&P 500) made new all time high after Flat correction
ES_F (S&P 500) made new all time high after Flat correction
By
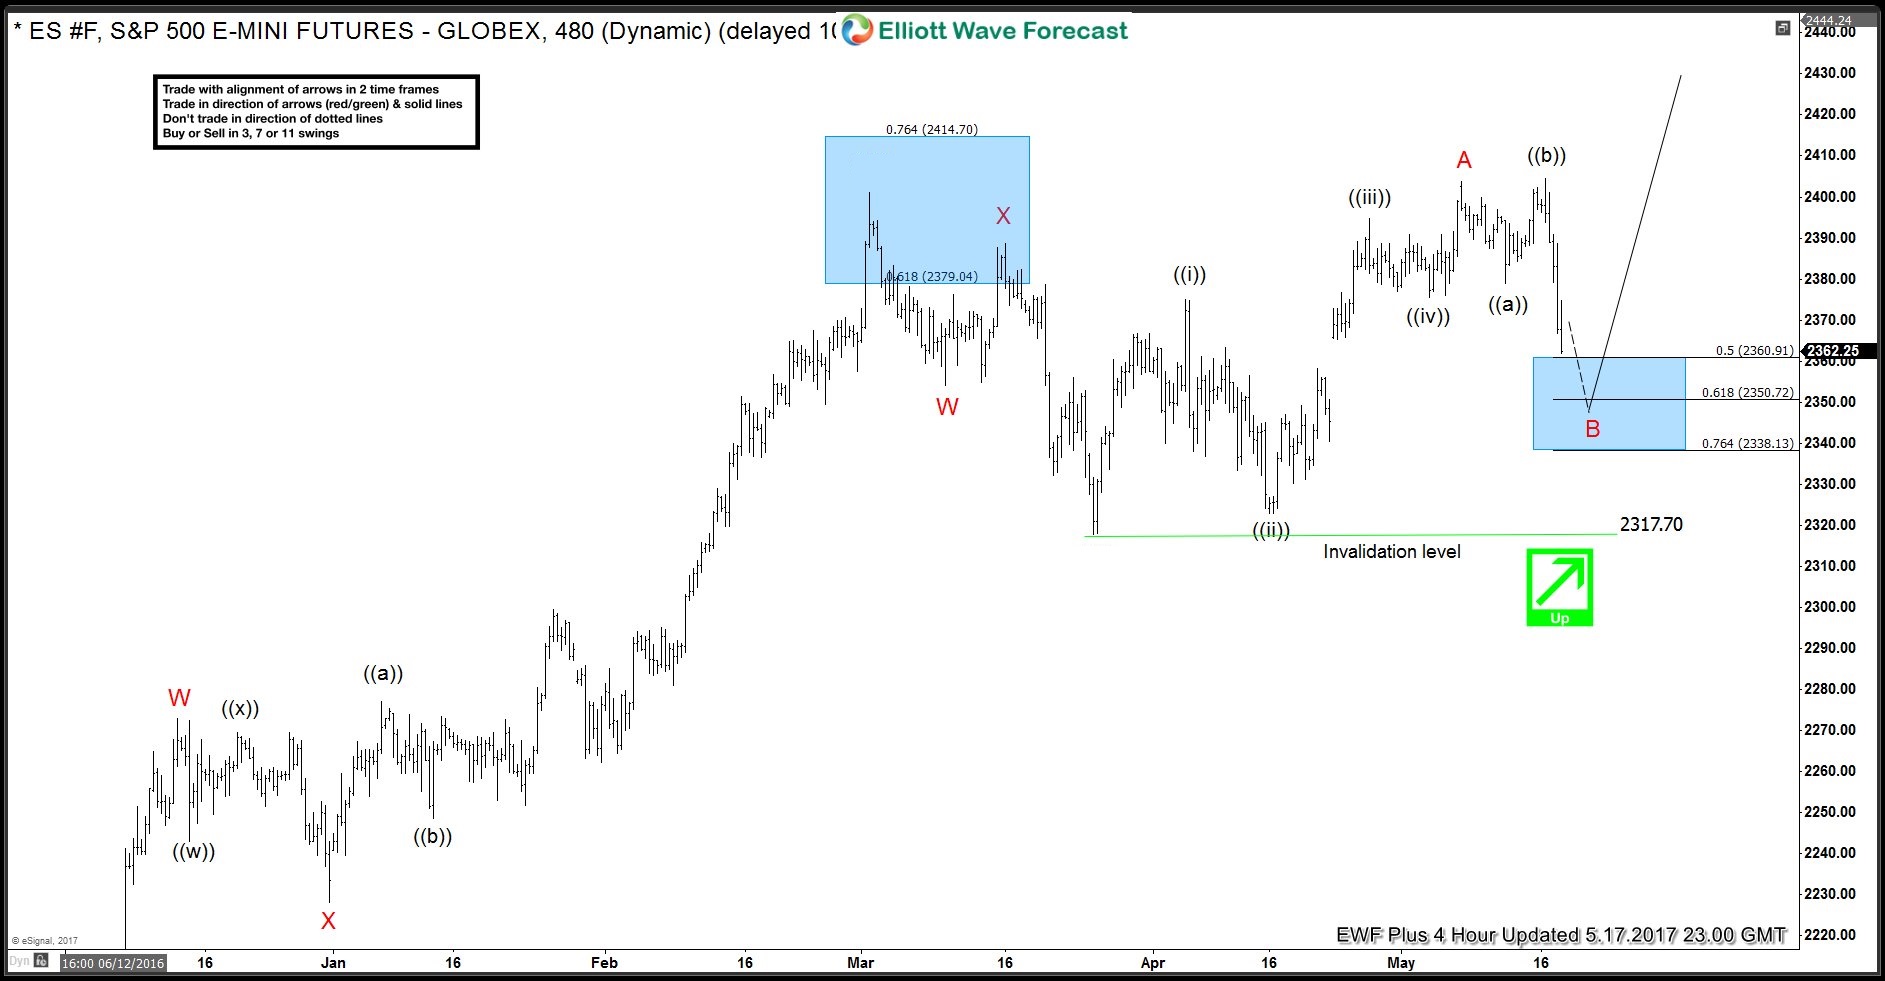
In this technical blog we’re going to take a look at the past Elliott Wave charts of $ES_F (S&P 500) published in members area of www.elliottwave-forecast.com and explain Elliott Wave Flat structure. As our members know, we were pointing out that $ES_F (S&P 500) is within bullish trend. Price structure has been calling for more strength once B red pull back completes as Expanded flat at 2360-2338 area. Consequently, we recommended our members to avoid selling it and keep going with the trend-buying the dips. The chart below is $ES_F (S&P 500) 4 hour chart from 05.17.2017.
$ES_F (S&P 500) Elliott Wave Expanded Flat
Before we take a look at the short term structure, let’s explain expanded flat in a few words.
Expanded Flat is a 3 wave corrective pattern which could often be seen in the market nowadays. Inner subdivision is labeled as A,B,C , with inner 3,3,5 structure. Waves A and B have forms of corrective structures like zigzag, flat, double three or triple three. Third wave C is always 5 waves structure, either motive impulse or ending diagonal pattern. It’s important to notice that in Expanded Flat Pattern wave B completes below/above the start point of wave A , and wave C ends above/below the ending point of wave A which makes it Expanded. Wave C of expanded completes usually close to 1.236 Fibonacci extension of A related to B, but sometimes it could go up to 1.618 fibs ext
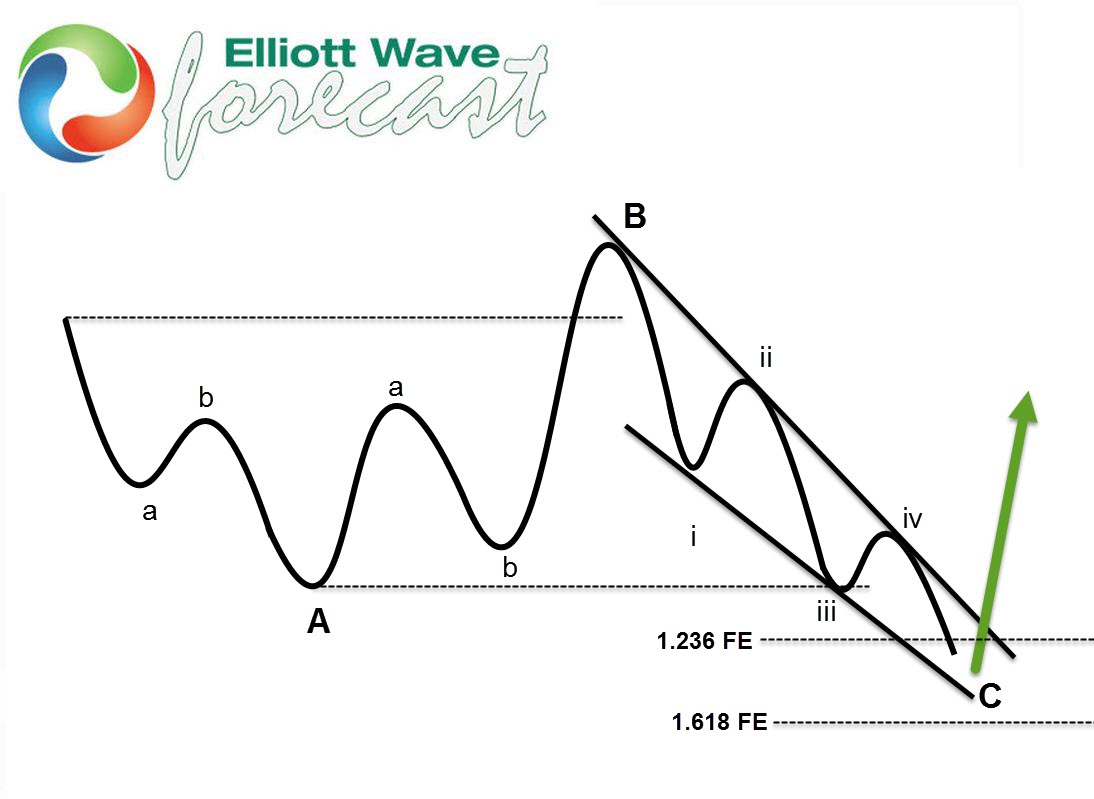
Now let’s see what this pattern looks like in real market example.
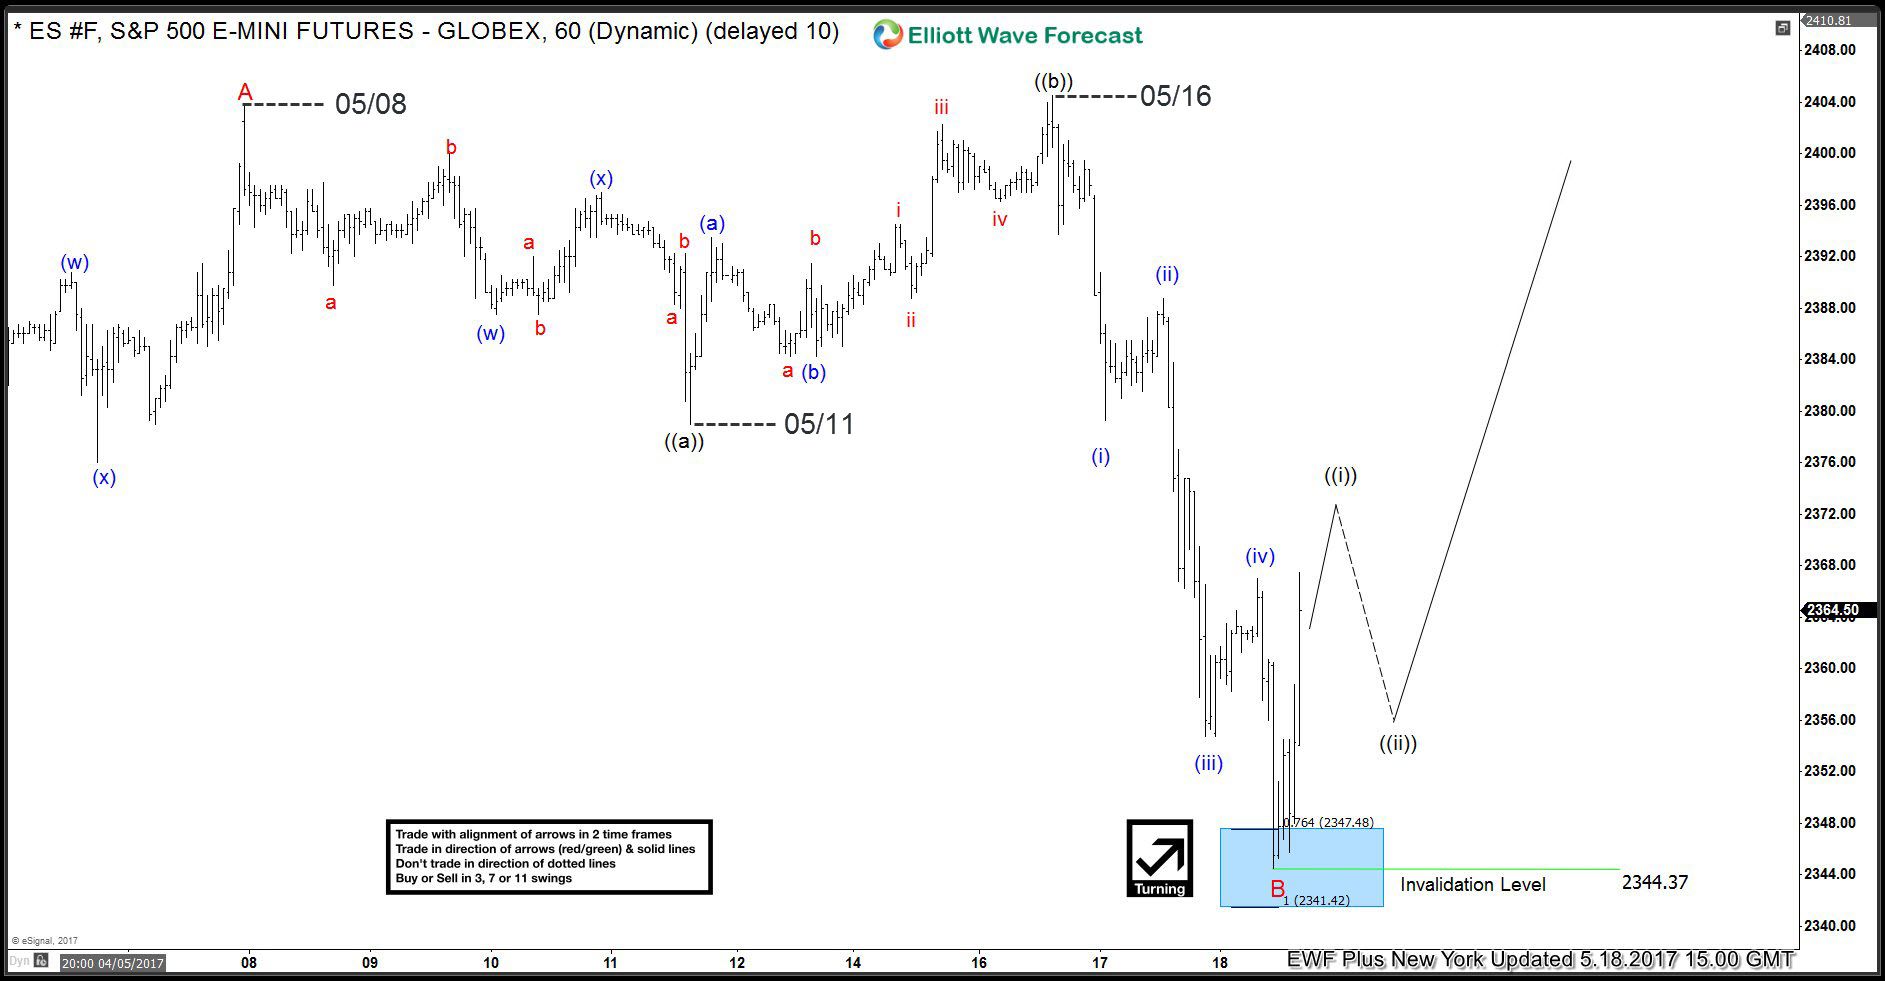
$ES_F (S&P 500) 1 Hour chart: 5/18/2017
We can see that wave B has unfolded as Expanded Flat, when waves ((a)) and ((b)) are 3 waves structures, while wave ((c)) is 5 waves. Wave ((b)) has broken above starting point of Flat and wave ((c)) got extended to the downside making this correction Expanded Flat. Although ((c)) got extended, B red pull back ended right at proposed area 2360-2338 ( referring to 4 hour chart above).
As far as the price stays above 2344.37 low, we’re calling wave B red pull back completed there
Update charts and of $ES_F (S&P 500) can be found in the membership area of EWF. ( If not a member yet just sign up for 14 days Free Trial)
Proper Elliott Wave counting is crucial in order to be a successful trader. If you want to learn more on how to implement Elliott Wave Theory in your trading and to learn more about next trading opportunities in the Market, try us free for 14 days. You will get access to Professional Elliott Wave analysis in 4 different time frames. Strategy of the Day/Week Video ,Live Trading Room , 2 live Analysis Session done by our Expert Analysts every day. 24 Hour Chat Room support, Market Overview, Weekly technical videos and much more…
If you are not member yet, use this opportunity and sign up now to get your Free 14 days Trial.
Welcome to Elliott Wave Forecast !

Elliottwave-Forecast.com (by EME PROCESSING AND CONSULTING LLC) was founded in 2005 by Eric Morera. Since inception our company has provided tailored Financial Market Services to thousands of clients. ElliottWave-Forecast has built a reputation on accurate technical analysis and a winning attitude. By successfully incorporating the Elliott Wave Theory with Market Correlation, Cycles, Proprietary Pivot System, we provide precise forecasts with up-to-date analysis for 52 instruments including FX majors, Gold, Silver, Copper, Oil, TNX and major Equity Indices. Our clients also have immediate access to our proprietary Actionable Trade Setups, Market Overview, 1 Hour, 4 Hour, Daily & Weekly Wave Counts. Weekend Webinar, Live Screen Sharing Sessions, Daily Technical Videos, Educational Resources, and 24 Hour chat room where they are provided live updates and given answers to their questions.
Unfortunately, this report is not available for the investor type or country you selected.
Browse all ResearchPool reportsReport is subscription only.
Thank you, your report is ready.
Thank you, your report is ready.