Forecasting the rally in DAX Index
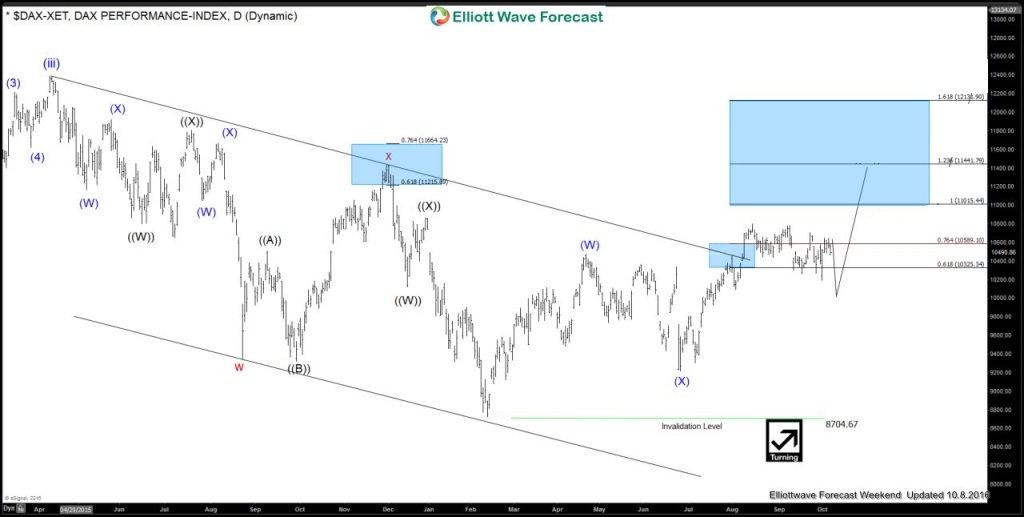
In this technical blog, we will take a look at some charts of DAX Stock Index presented to clients of Elliottwave-Forecast.com over the last few weeks. For the last few months EWF members knew that Global Indices had been in a bullish cycle and it offered some nice buying opportunities in the dips in 3, 7 or 11 swings because following this technique, even if the trend doesn’t resume, we mostly get a 3 wave bounce at least which allows clients to get into a risk free position. Now let’s take a look at Daily chart of DAX instrument dated October 8th 2016, which was showing incomplete Elliott wave bullish sequence from (8704) February 2016 low, i.e. index was showing 5 swings from that low & was also missing the extreme (100%-123.6% fib extension) blue box area (11015-11441) to the upside to complete the 7 swing structure from the lows. In case any of you wondering the upside cycle from February low was in 5 swings then why we were anticipating another leg higher? It was because the move from Feb lows was over lapping corrective move ( not impulsive ) & thus suggested the another extension higher in the DAX Index.
Now let’s take a look at some 1 hour price action that developed in the instrument this month, below is the 1 hour chart from December 1st NY midday updated chart showing pullback happening from November 10th peak within wave X in red to correct November 9th lows (10016), Thus strategy was to buy the dips in the instrument against November 9 low (10016) in sequence of 3, 7 or 11 swings. Since then index made the pullback, as we can easily spot that pullback was in 11 swings ( which is mainly known as triple three W,X,Y,Z ), And 10481-10349 area was expected to find buyers in the instrument for continuation higher in the instrument for potential upside target at 11015-11441 to the upside or for 3 swing bounce at least.

Since then index bounced from our blue box area as expected & formed the low at 10400 area, thus allowed our members to create a risk free position in the index as can be seen below. Up till today index has rallied more than 800 points in our favor & now has reached the Daily target area ( 11015-11441).

Important Note: Chasing the log side at this stage of Market can risky but keep in mind Market is dynamic and moves sometimes can extend higher, in the meantime we have developed a special skill to identify complex correction before they takes place in market based on correlations, cycles & pivots. If you want to know the future path of $DAX & other Global indices join us through Free 14 day trial.

Elliottwave-Forecast.com (by EME PROCESSING AND CONSULTING LLC) was founded in 2005 by Eric Morera. Since inception our company has provided tailored Financial Market Services to thousands of clients. ElliottWave-Forecast has built a reputation on accurate technical analysis and a winning attitude. By successfully incorporating the Elliott Wave Theory with Market Correlation, Cycles, Proprietary Pivot System, we provide precise forecasts with up-to-date analysis for 52 instruments including FX majors, Gold, Silver, Copper, Oil, TNX and major Equity Indices. Our clients also have immediate access to our proprietary Actionable Trade Setups, Market Overview, 1 Hour, 4 Hour, Daily & Weekly Wave Counts. Weekend Webinar, Live Screen Sharing Sessions, Daily Technical Videos, Educational Resources, and 24 Hour chat room where they are provided live updates and given answers to their questions.
Unfortunately, this report is not available for the investor type or country you selected.
Browse all ResearchPool reportsReport is subscription only.
Thank you, your report is ready.
Thank you, your report is ready.