Gold Elliott wave Zigzag pattern
Gold 1 hour chart 2/21/2017

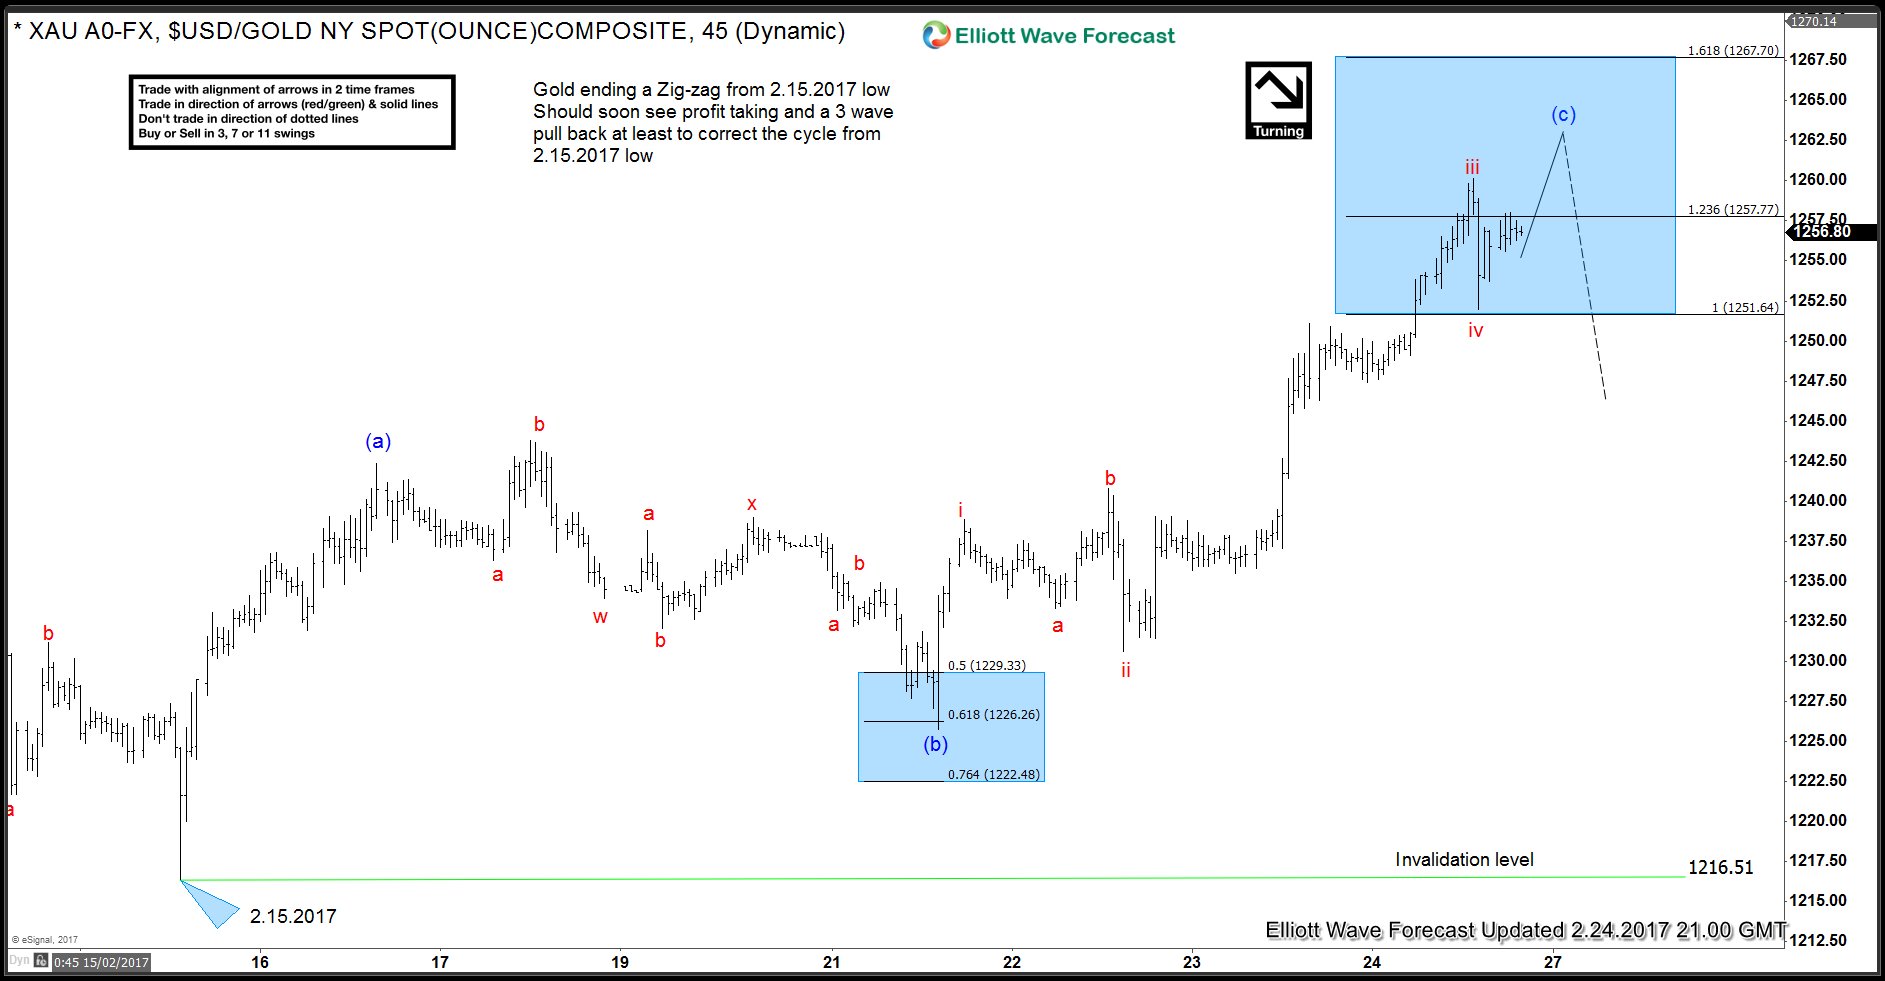
Here’s the Gold latest 1 hour chart showing the bounce from 1229-1222 blue box area as expected in 5 waves within (c) higher. Currently metal has reached another blue box area which is a profit taking area and we think the zig-zag structure from 1216 low can end in this area between 1251 – 1267 resulting in a 3 wave pull back at minimum.
Gold 1 hour chart 2/24/2017
If you enjoyed this article, feel free to try our Free 14 day trial . we provide Elliott Wave charts in 4 different time frames, up to 4 times a day update in 1 hour chart, two live sessions by our expert analysts, 24 hour chat room moderated by our expert analysts, market overview, and much more! Try us out for Free 14 day trial & starts making profits with us.

Elliottwave-Forecast.com (by EME PROCESSING AND CONSULTING LLC) was founded in 2005 by Eric Morera. Since inception our company has provided tailored Financial Market Services to thousands of clients. ElliottWave-Forecast has built a reputation on accurate technical analysis and a winning attitude. By successfully incorporating the Elliott Wave Theory with Market Correlation, Cycles, Proprietary Pivot System, we provide precise forecasts with up-to-date analysis for 52 instruments including FX majors, Gold, Silver, Copper, Oil, TNX and major Equity Indices. Our clients also have immediate access to our proprietary Actionable Trade Setups, Market Overview, 1 Hour, 4 Hour, Daily & Weekly Wave Counts. Weekend Webinar, Live Screen Sharing Sessions, Daily Technical Videos, Educational Resources, and 24 Hour chat room where they are provided live updates and given answers to their questions.
Unfortunately, this report is not available for the investor type or country you selected.
Browse all ResearchPool reportsReport is subscription only.
Thank you, your report is ready.
Thank you, your report is ready.