IBEX: Triple Three Elliott Wave Structure
In this Technical blog we’re going to take a quick look at the past Elliott Wave chart of IBEX chart from March 22,2017, which were presented to the clients at elliottwave-forecast.com. We are going to explain the structure & see how the index continued the rally afterwards.
IBEX 1 Hour March 22 London updated chart
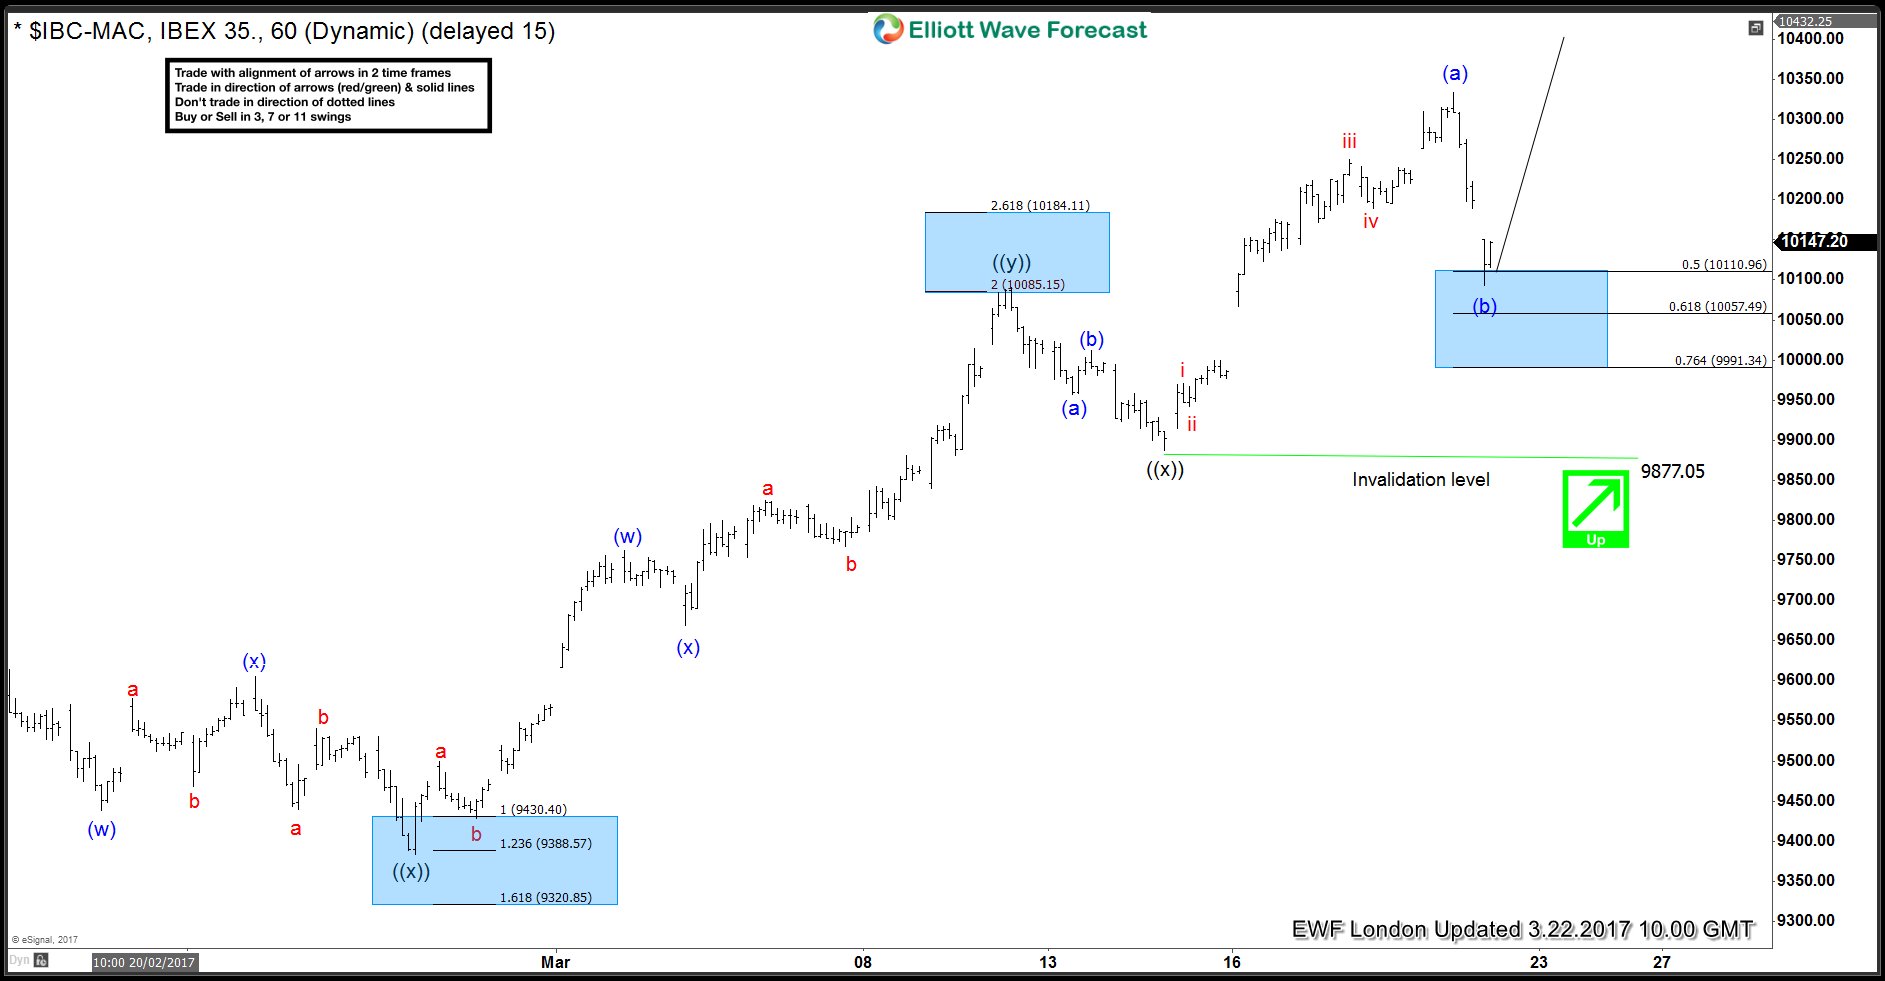
Above chart is showing Elliott wave Triple three sequence remains in progress within the cycle from 2/08 lows, in Minute degree and index was showing 9 swings bullish sequence from that cycle favoring more upside extension as far as dips remains above 9877 second wave ((x)) connector low (9877). Also the sequence from 9877 low looks to be impulsive rather then corrective, thus creating a possible Elliott wave zigzag structure was in progress. According to Elliott wave theory Zigzag is a 3 wave structure having internal subdivision of (5-3-5) swing sequence where internal subdivisions are labeled as A, B, C where A = 5 waves, B = 3 waves and C = 5 waves. This means that A and C can be impulsive or diagonal waves. Also the A and C waves must meet all the conditions of 5 wave structure, such as: having an RSI divergence between wave subdivisions, ideal Fibonacci extensions, ideal retracements etc. So our Strategy was to buy the Intraday Minutte wave (b) pullback from 50-764% fib ret area ( 10110-9991 ) blue box area for another extension higher in the index provided the pivot at 9877 low remains intact or for 3 wave bounce at least.
IBEX 1 Hour March 31 NY Midday updated chart
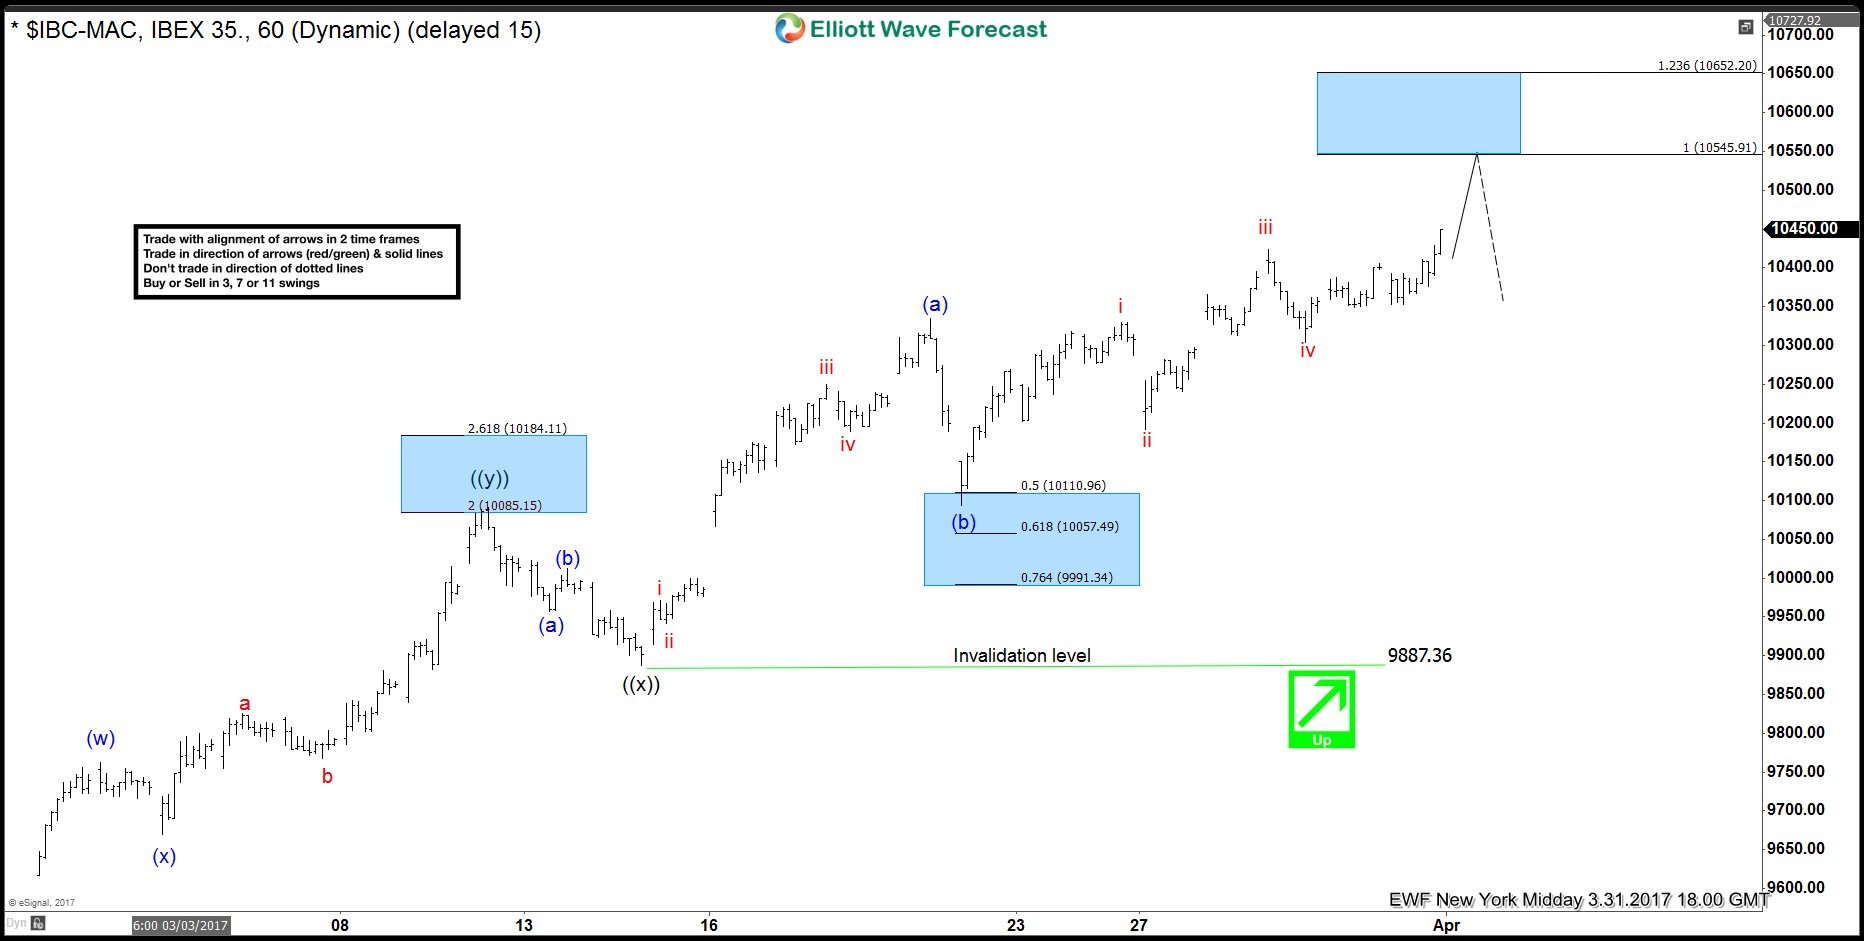
Index found the buyer’s from the blue box area as expected & ended wave (b) pullback at 10110 low. Up from there index started the another 5 waves as expected in wave (c) higher & now should be ideally looking for 10545 – 10652 area next week and make a 3 wave pull back at least from there. We don’t like the selling but 10545 is the area for longs from 10110 to book profits and RSI divergence at the peak should stay intact for the 5 waves in (c) idea to remains valid. Note if it gets erased during the next high, then it could end up being a (w) – (x) – (y) triple three structure from 9887 low.
If you enjoyed this article, feel free to try our Free 14 day trial . we provide Elliott Wave charts in 4 different time frames, up to 4 times a day update in 1 hour chart, two live sessions by our expert analysts, 24 hour chat room moderated by our expert analysts, market overview, and much more! Try us out for Free 14 day trial & starts making profits with us.

Elliottwave-Forecast.com (by EME PROCESSING AND CONSULTING LLC) was founded in 2005 by Eric Morera. Since inception our company has provided tailored Financial Market Services to thousands of clients. ElliottWave-Forecast has built a reputation on accurate technical analysis and a winning attitude. By successfully incorporating the Elliott Wave Theory with Market Correlation, Cycles, Proprietary Pivot System, we provide precise forecasts with up-to-date analysis for 52 instruments including FX majors, Gold, Silver, Copper, Oil, TNX and major Equity Indices. Our clients also have immediate access to our proprietary Actionable Trade Setups, Market Overview, 1 Hour, 4 Hour, Daily & Weekly Wave Counts. Weekend Webinar, Live Screen Sharing Sessions, Daily Technical Videos, Educational Resources, and 24 Hour chat room where they are provided live updates and given answers to their questions.
Unfortunately, this report is not available for the investor type or country you selected.
Browse all ResearchPool reportsReport is subscription only.
Thank you, your report is ready.
Thank you, your report is ready.