NZDUSD : Wait for Pullback then Buy Again
NZDUSD : Wait for Pullback then Buy Again
NZDUSD is showing 2 bullish patterns on the daily chart so we are expecting for the pair to continue higher. A move lower will now give bulls a chance to push the pair higher. Below we will show the possible bullish scenarios where bulls can enter the market and catch the move higher.
NZDUSD Daily Chart 2 Possible Bullish Patterns: Traders need to wait for NZDUSD to terminate red point C between the red AB 1.618% – AB 2.24% Fib. levels. A move lower from the suggested area to the red BC 0.50% Fib. retracement level will trigger BUYS. As long as price stays above the red point B low, watch for NZDUSD to make another swing higher. There is also strong support/resistance at the red BC 0.50% area which will allow a possible bounce higher. Watch for move higher towards the blue AB 2.24% Fib. level.
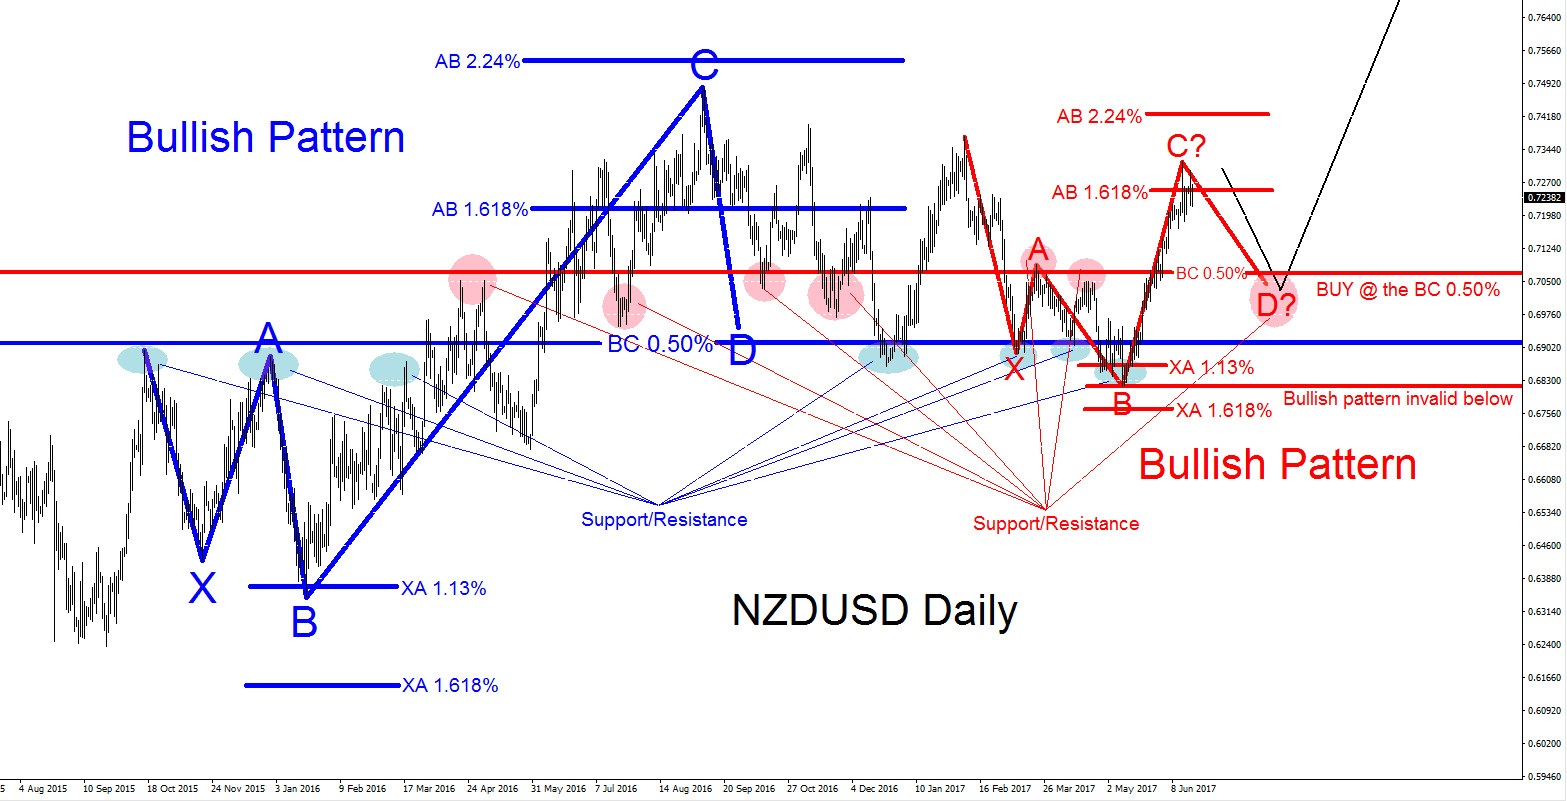
If looking to buy NZDUSD we prefer waiting for a retracement/pullback to trigger the red point D sell at the BC 0.50%. Stops should be placed at 0.6816 (point red B low) and should be bought at the BC 0.50% Fib. level minimum for a better risk/reward trade with targets above the blue AB 2.24% Fib. level.
Of course, like any strategy/technique, there will be times when the strategy/technique fails so proper money/risk management should always be used on every trade. Hope you enjoyed this article and follow me on Twitter for updates and questions> @AidanFX or chat me on Skype > EWF Aidan Chan
*** Always use proper risk/money management according to your account size ***
At Elliottwave-Forecast we cover 52 instruments (Forex, Commodities, Indices) in 4 different timeframes and we offer 3 Live Session Webinars everyday. We do Daily Technical Videos, Elliott Wave Trade Setup Videos and we have a 24 Chat Room. Our clients are always in the loop for the next market move.
Try Elliottwave-Forecast for 14 days FREE !!! Just click here –> 14 day FREE trial

Elliottwave-Forecast.com (by EME PROCESSING AND CONSULTING LLC) was founded in 2005 by Eric Morera. Since inception our company has provided tailored Financial Market Services to thousands of clients. ElliottWave-Forecast has built a reputation on accurate technical analysis and a winning attitude. By successfully incorporating the Elliott Wave Theory with Market Correlation, Cycles, Proprietary Pivot System, we provide precise forecasts with up-to-date analysis for 52 instruments including FX majors, Gold, Silver, Copper, Oil, TNX and major Equity Indices. Our clients also have immediate access to our proprietary Actionable Trade Setups, Market Overview, 1 Hour, 4 Hour, Daily & Weekly Wave Counts. Weekend Webinar, Live Screen Sharing Sessions, Daily Technical Videos, Educational Resources, and 24 Hour chat room where they are provided live updates and given answers to their questions.
Unfortunately, this report is not available for the investor type or country you selected.
Browse all ResearchPool reportsReport is subscription only.
Thank you, your report is ready.
Thank you, your report is ready.