One of the most common Traps in Elliott Wave Trading
In this technical blog we’re going to give you some tips on how to avoid one of the most common traps in Elliott Wave trading. We will try to close you to our strategy, emphasizing importance of trading with the trend.
Many beginner traders believe that spotting formation of a good pattern or clear Elliott wave count on 1 Hour, 30 minutes or even 15 minutes time frame is enough to make good trading decisions. Unfortunately that’s not the case. Trading in that manner leads to many negative trades and missed opportunities, however many traders keep falling in that trap.
At Elliott Wave Forecast, our market experts follow more than 50 global financial instruments and base forecasts on the most clearest structures at any given time. We spot incomplete swings sequences in higher time frames like 4 Hour , daily or even weekly charts and look for potential entries on lower time frames. Patterns in short term are used only to determine potential entry areas so we can go with the flow of the major trend. Before we continue, here’s a short reminder :check out new EWF blogs and Free charts.
We’ll explain more through EURUSD example
The chart below is a 1 Hour Elliott Wave London update of EURUSD from 11.15.2016. The pair has made clear 3 wave Elliott wave bounce from the lows. Second X connector is about to complete at 1.0808-1.0848 ( sell zone).We advised our members to avoid buying the pair and favor the short side.
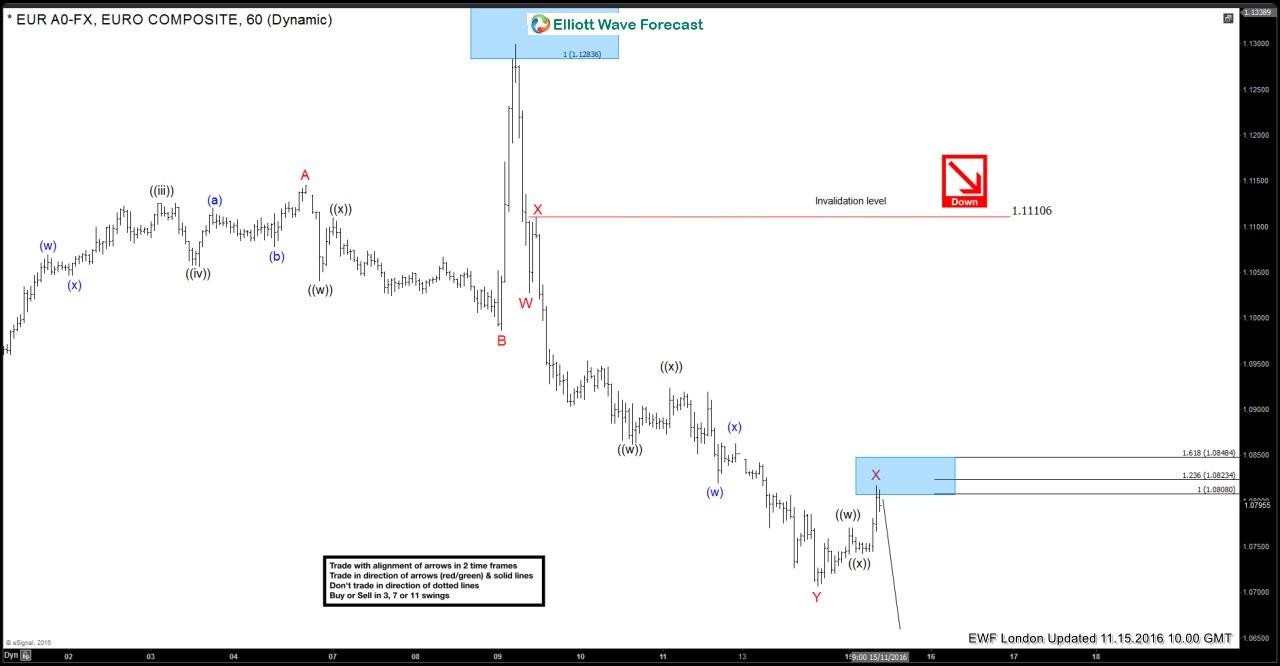
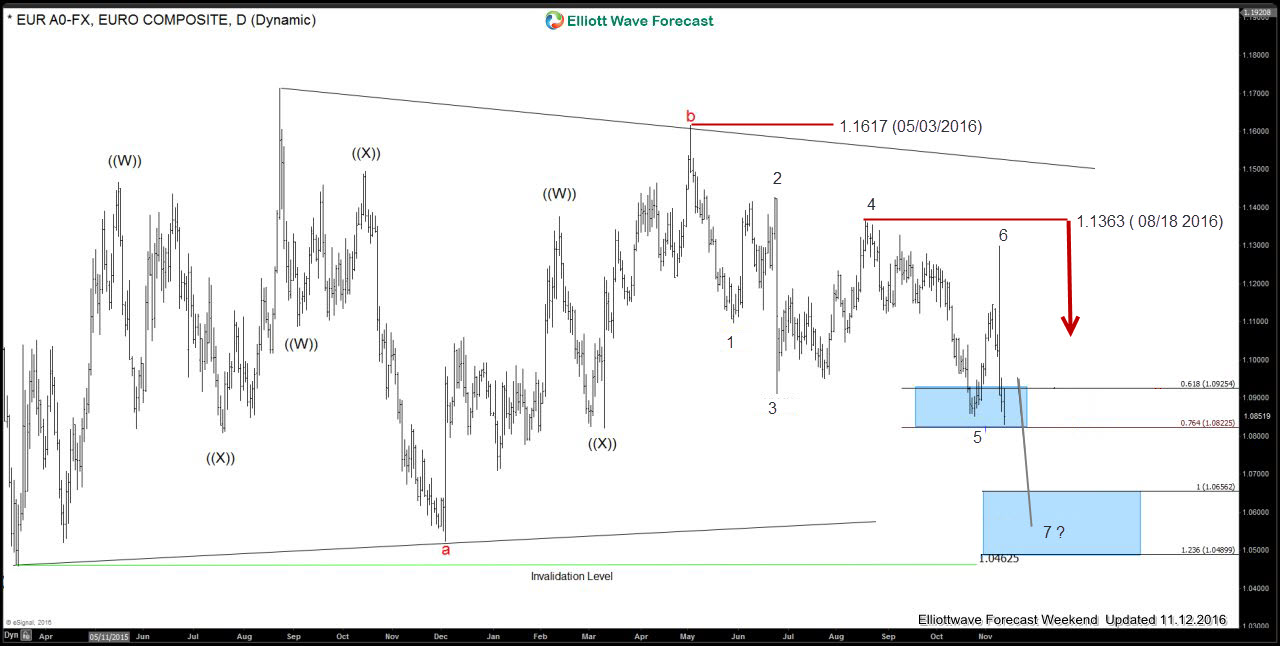
It’s important to understand that we didn’t base our bearish forecast and sell decision on 1 Hour price structure and we used this time just to determine the inflection area and potential entry zone : 1.808-1.0648. 1 Hour Elliott Wave analysis is only the tip of the iceberg. True essence lies in the deep swing-cycle , distribution and market correlation analysis of the higher time frames. In this case, we look at the daily chart to spot an incomplete bearish sequence from 5.3.2016 peak which was calling for more downside to reach the target area.
EURUSD Weekend Elliott Wave update 11.12.2016
The price is showing incomplete bearish swings sequences in the cycle from the 5.3.2016 peak (1.1617). The decline from the mentioned peak is unfolding as a clear 7 swings structure. It’s suggesting further decline as 7th swing is missing the target area 1.0656-1.0489. Eventually the price reached the mentioned target area, making decline of approximately 300 pips from 1 Hour sell zone 1.808-1.0648.
Our market experts educate members constantly through live sessions, also providing you with money management and trading psychology tips. With us you keep growing not only as an Elliott Wave analyst, but also as a trader.
If not a member yet, you have an opportunity to sign up now and get 14 days Trial .

Elliottwave-Forecast.com (by EME PROCESSING AND CONSULTING LLC) was founded in 2005 by Eric Morera. Since inception our company has provided tailored Financial Market Services to thousands of clients. ElliottWave-Forecast has built a reputation on accurate technical analysis and a winning attitude. By successfully incorporating the Elliott Wave Theory with Market Correlation, Cycles, Proprietary Pivot System, we provide precise forecasts with up-to-date analysis for 52 instruments including FX majors, Gold, Silver, Copper, Oil, TNX and major Equity Indices. Our clients also have immediate access to our proprietary Actionable Trade Setups, Market Overview, 1 Hour, 4 Hour, Daily & Weekly Wave Counts. Weekend Webinar, Live Screen Sharing Sessions, Daily Technical Videos, Educational Resources, and 24 Hour chat room where they are provided live updates and given answers to their questions.
Unfortunately, this report is not available for the investor type or country you selected.
Browse all ResearchPool reportsReport is subscription only.
Thank you, your report is ready.
Thank you, your report is ready.