$TNX Elliott wave forecasting the rally
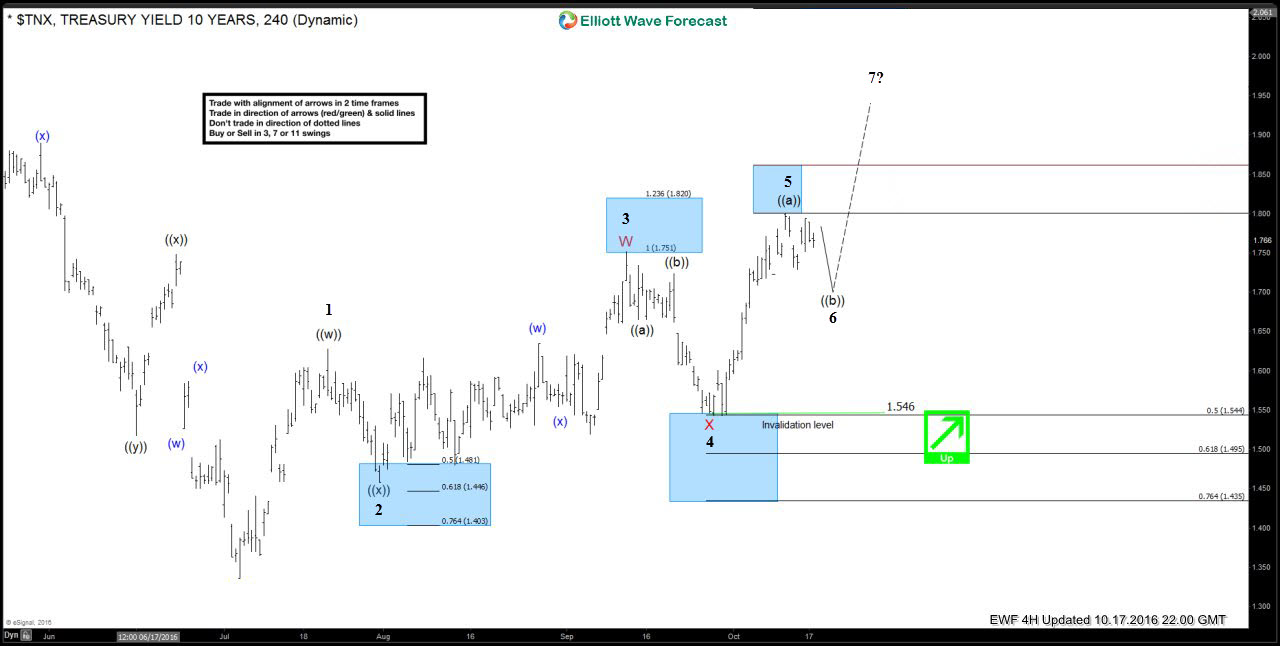
Hello fellow traders, in this technical blog we’re going to take a quick look of the price structure of $TNX and explain the swing sequences. The Elliott Wave chart below present EWF’s forecast from October 17th 2016 with added swings labelling . Back then, the instrument was showing incomplete bullish structure in the cycle from the July 6th low @1.336, suggesting short term pull back in 6th swing, presented as wave ((b)) and final push up in 7th swing.We advised our members to avoid selling $TNX and keep buying the dips in 3,7,11 swings against the 1.546 low.
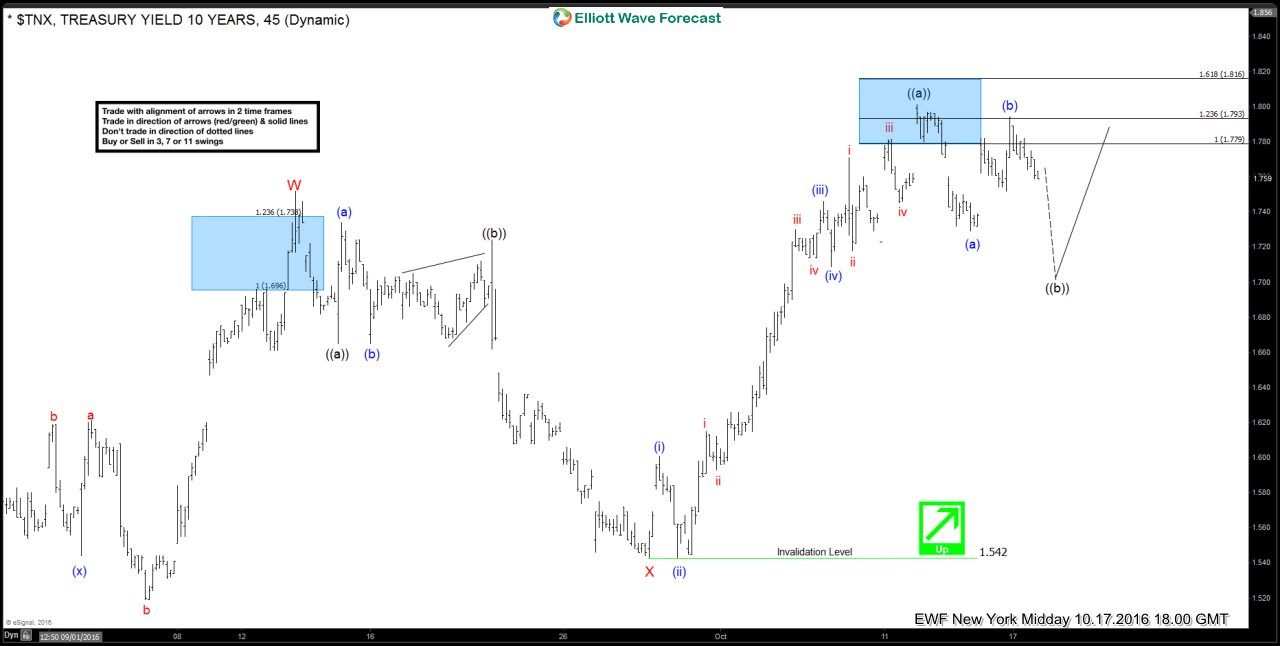
Now let’s take a look at the short term price structure. The chart below is Short-term Mid-day New York Update from October 17th, suggesting the wave ((b)) pull back is unfolding as (a)(b)(c) structure after which yields should turn higher and resume the rally or bounce in 3 waves at least.
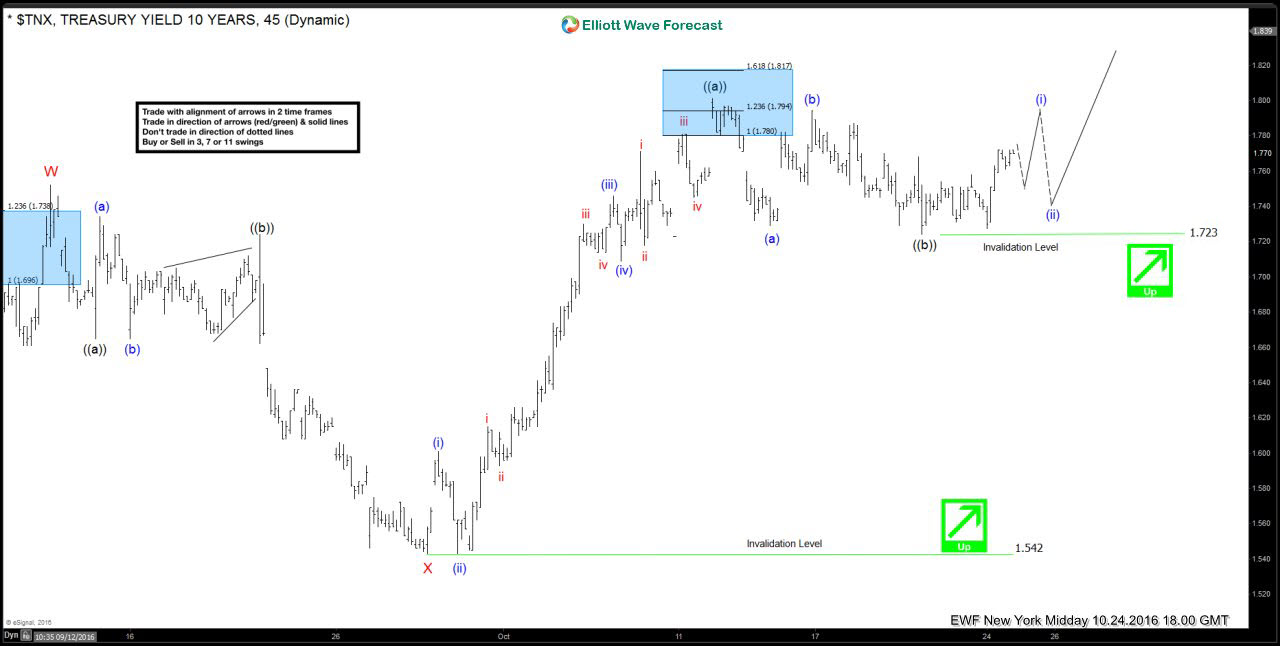
$TNX New York Midday update 10.24.2016 The price was staying sideways for a while and once it broke above the 1.768 short term high, we knew that another leg lower is less likely and we called the ((b)) pull back completed at 1.723 as a truncation (it missed ideal entry area)
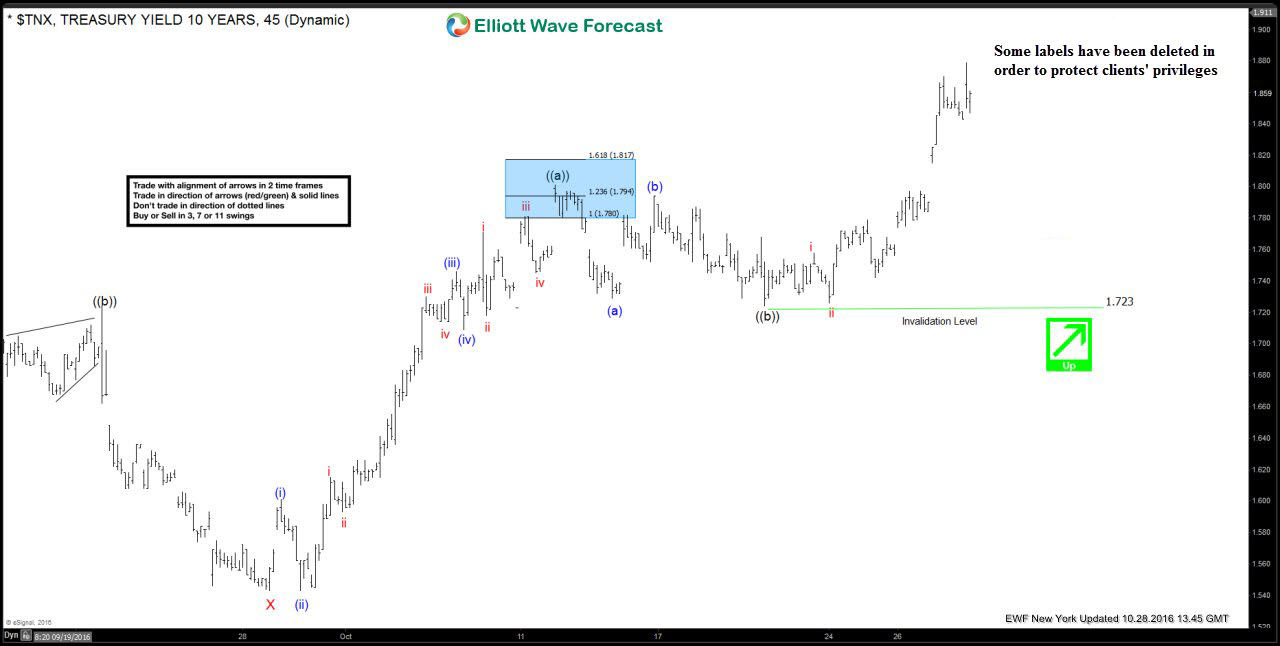
$TNX NY update 10.28.2016 the instrument is trading higher in 7th swing as expected and rally broke the previous high at 1.801, confirming our forecast. Note: same labels have been removed in order to protect clients’ privileges.
Keep in mind that market is dynamic and the view could change in mean time. If you’re interested in the future path of $TNX or in any of the other 50+ instruments we cover, you can find Elliott Wave analysis in the membership area. ( If not a member yet, all you have to do is to Sign Up for Free 14 Days Trial )
Success in trading requires proper risk/money management, so does understanding of Elliott Wave theory, Cycle and Correlation analysis.
Through time we have developed a very respectable trading strategy which defines Entry, Stop Loss and Take Profit levels with high accuracy and allows you to make position Risk Free, shortly after taking it, protecting your account. If you want to learn all about it and become a professional Trader, sign up now and get 14 DAYS FREE TRIAL .
You will get access to Professional Elliott Wave analysis in 4 different time frames, Strategy of the Day/Week Video, Live Trading Room, 2 live Analysis Session done by our Expert Analysts every day, 24 Hour Chat Room support, Market Overview, Weekly technical videos and much more…
Welcome to Elliott Wave Forecast!


Elliottwave-Forecast.com (by EME PROCESSING AND CONSULTING LLC) was founded in 2005 by Eric Morera. Since inception our company has provided tailored Financial Market Services to thousands of clients. ElliottWave-Forecast has built a reputation on accurate technical analysis and a winning attitude. By successfully incorporating the Elliott Wave Theory with Market Correlation, Cycles, Proprietary Pivot System, we provide precise forecasts with up-to-date analysis for 52 instruments including FX majors, Gold, Silver, Copper, Oil, TNX and major Equity Indices. Our clients also have immediate access to our proprietary Actionable Trade Setups, Market Overview, 1 Hour, 4 Hour, Daily & Weekly Wave Counts. Weekend Webinar, Live Screen Sharing Sessions, Daily Technical Videos, Educational Resources, and 24 Hour chat room where they are provided live updates and given answers to their questions.
Unfortunately, this report is not available for the investor type or country you selected.
Browse all ResearchPool reportsReport is subscription only.
Thank you, your report is ready.
Thank you, your report is ready.