TSLA Elliott Wave Calling Higher & Buying the Dips
Tesla stock TSLA saw an impressive rally from the start of the year gaining +78% in 6 month before a correction took place and despite the recent decline the stock is still with +60% in profits. In this Technical Blog we’re going to take a quick look at the past Elliott Wave charts of TSLA and we’re going to take a look at the price structures and explain the forecast.
Early this year, we wrote an article “Do you want Tesla shares in your Portfolio ?†in which we forecasted a move higher above $300 and a break of the 3 year consolidation range.
TSLA Hourly Chart 03.18.2017

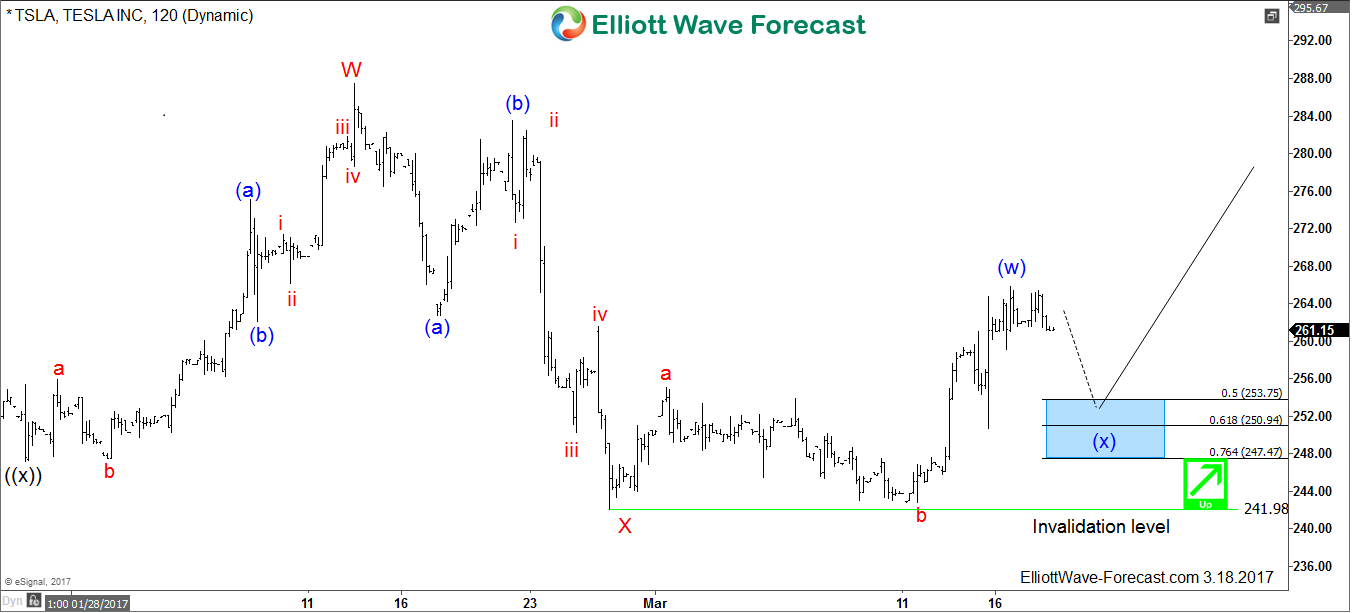
TSLA first rally from November 2016 low ended on 02/13/2017 peak and the pullback unfolded as a 3 waves Flat structure which is tricky to trade but the stock bounced from the 1.618 Fibonacci extension level $142 and started rallying from there. At that stage we kept looking for buying opportunities in 3 , 7 or 11 swing and the second one came within the pullback against 241 low as TSLA found buyers around the 50% – 76% Fibonacci retracement area ( 253 – 247 ).
TSLA Daily Chart 04.13.2107
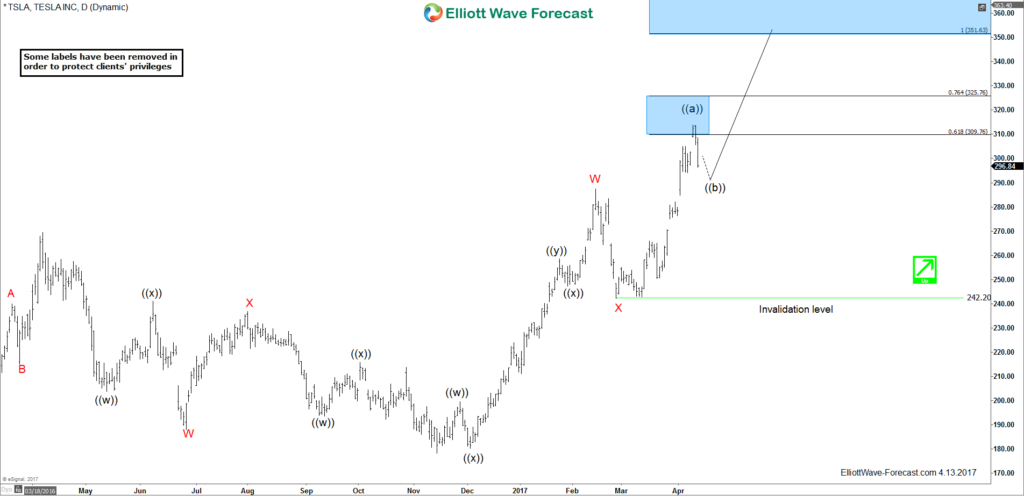

The automaker continued to impress as it managed to make new all time highs above 2014 peak which opened further extension to the upside showing an incomplete bullish sequence with a minimum target around $350 that’s why the stock remained supported into every dips in 3 , 7 or 11 swings.
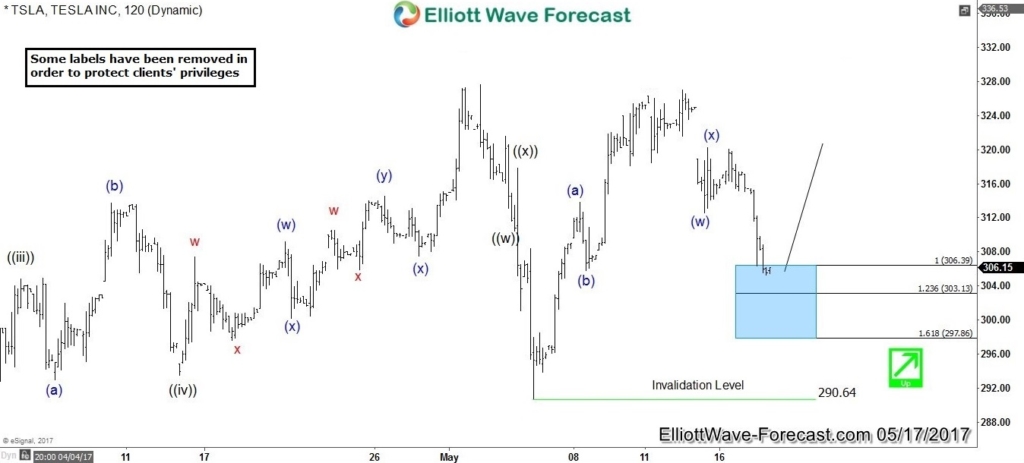
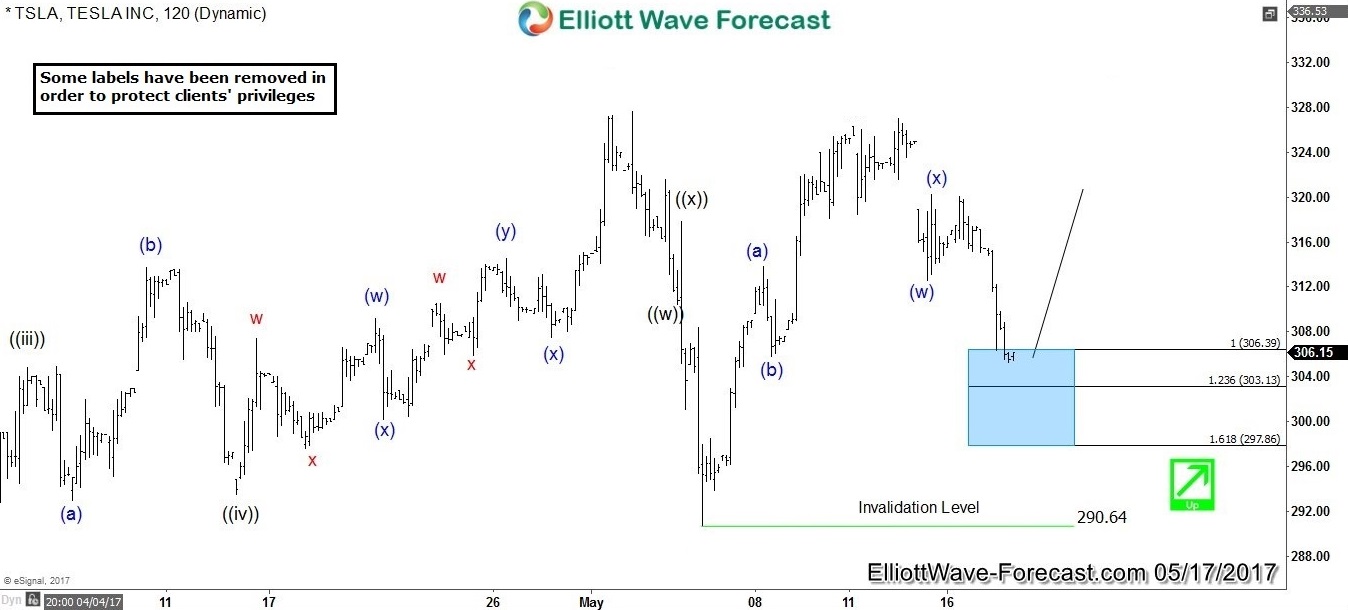
TSLA Hourly Chart 05.17.2107
TSLA Hourly Chart 06.12.2017

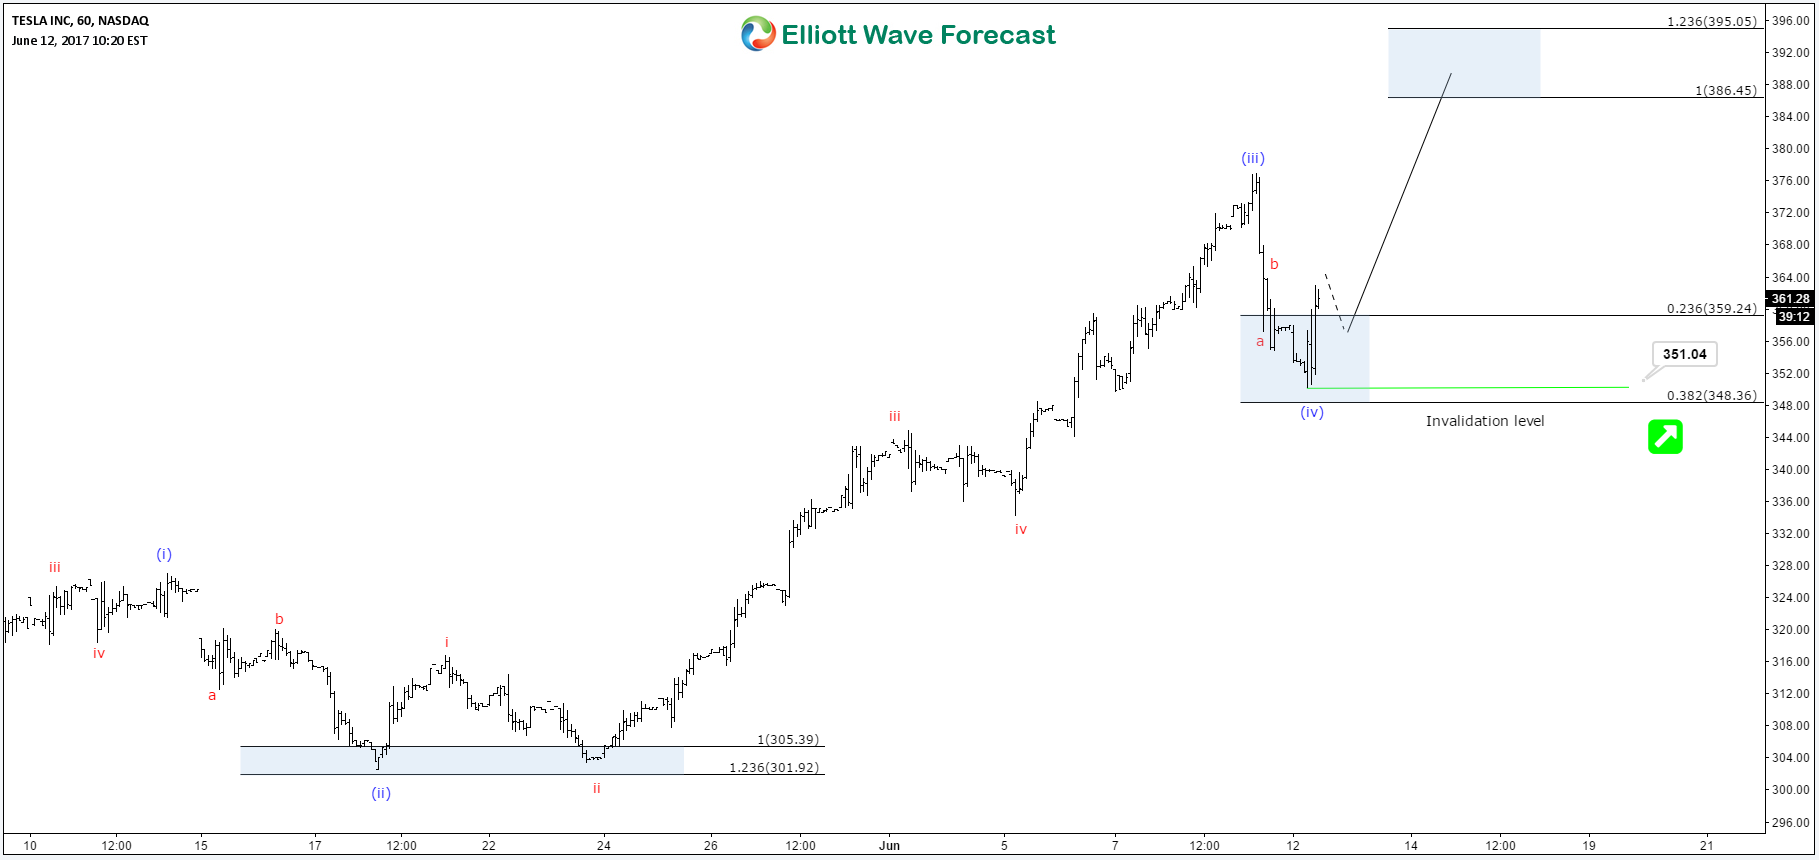
The short term price action was ideal to join the ride to the upside as the stock kept making new highs and every Elliott wave corrective pullback provided the right levels to be able to buy the stock with a specific stop. On June the 12th, TSLA was looking to do a final push higher toward equal legs area 386 – 395 before ending 5 waves move as part of a bigger cycle and that was the ideal target for buyers to take profits.
TSLA Daily Chart 07.06.2017

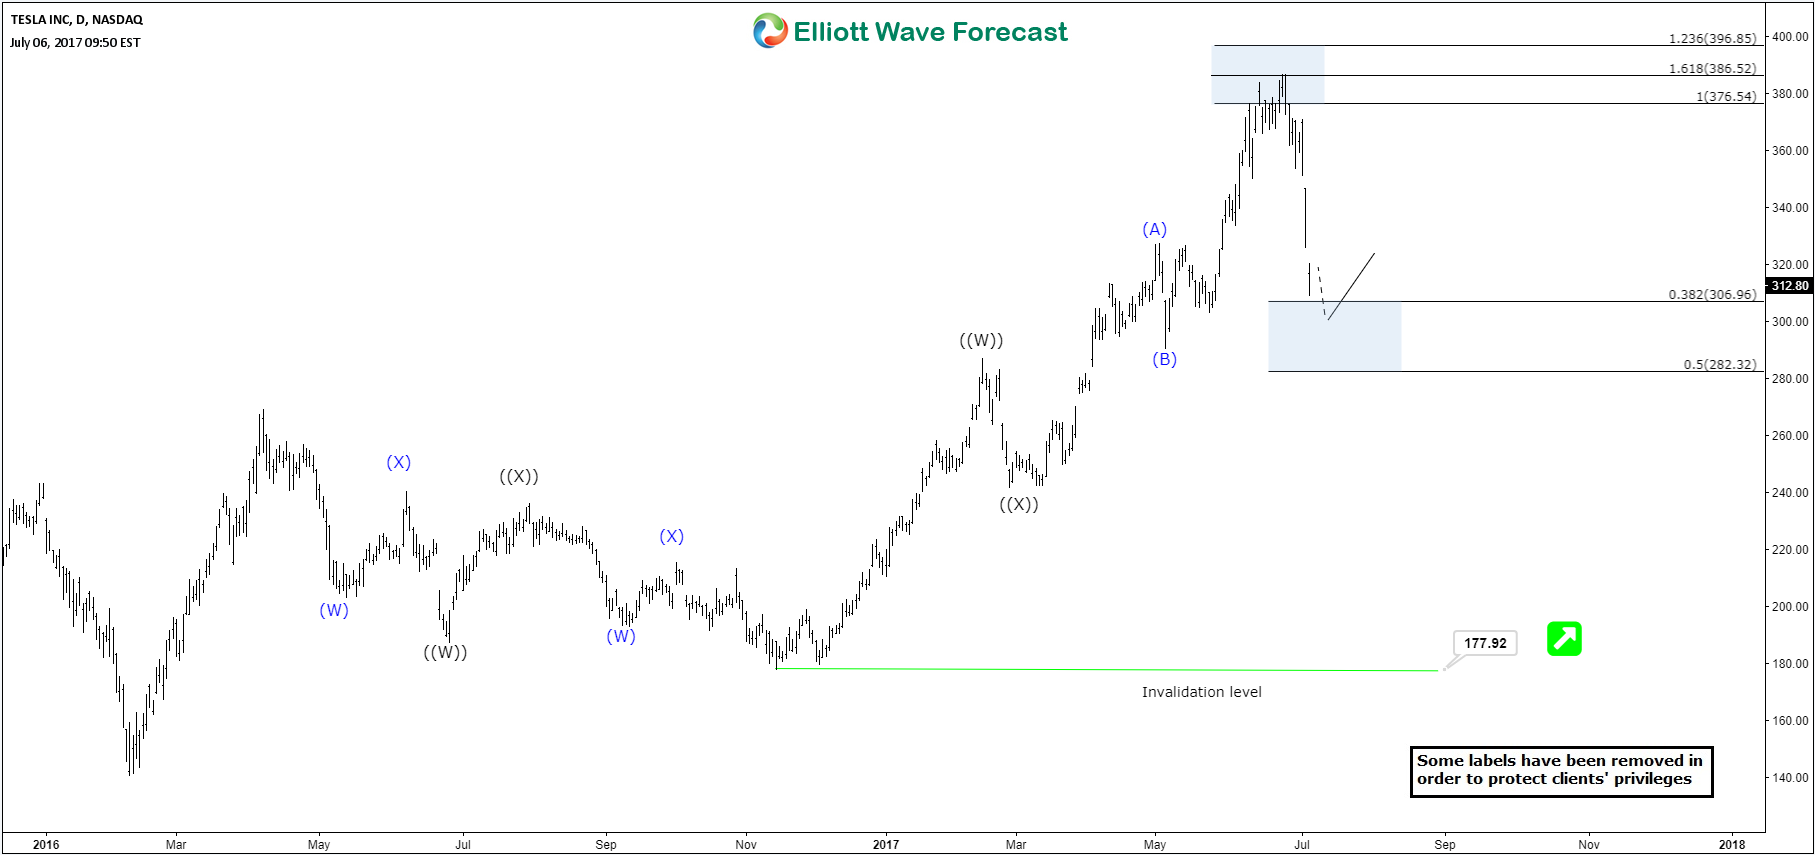
From the mentioned area above, TSLA made a sharp correction to the downside and managed to end the cycle from November lows. However, buyers appeared again at the blue box area ( 306 – 282 ) where a 3 waves bounce at least were expected to happen.
TSLA Hourly Chart 08.02.2017

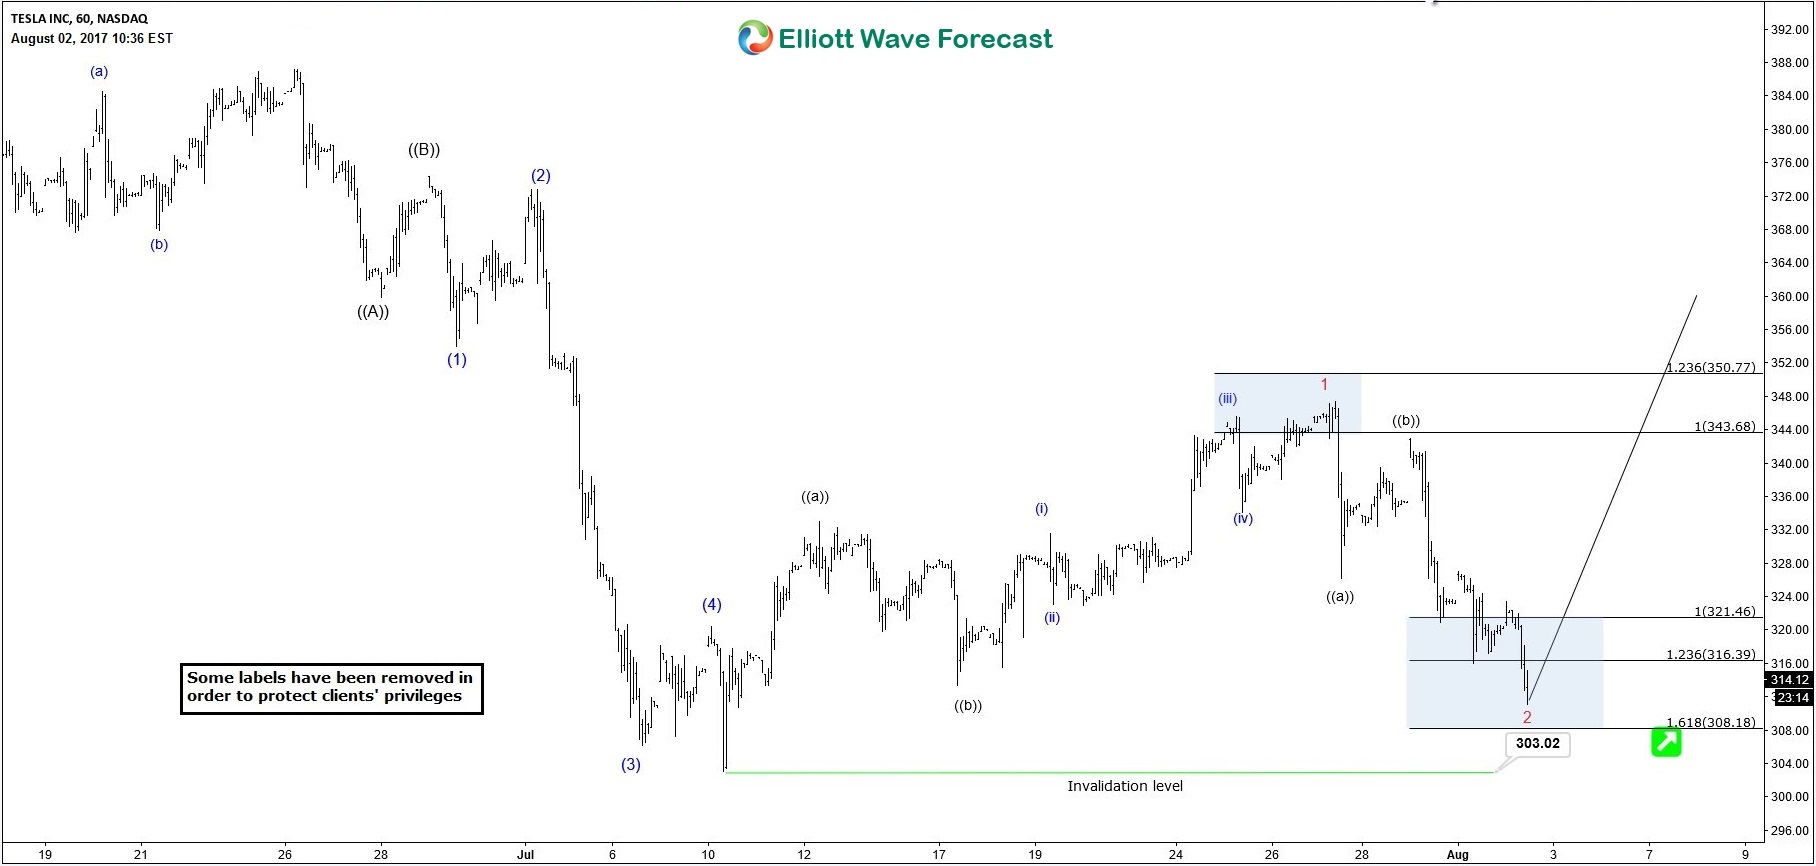
On 08/02/2017, we were looking for the stock to hold above the $303 low and rally from a short term extreme area. Later that day, Tesla reported it’s earning with a better number then expected in revenue which made the stock surge 8% after the close. But will it be able to continue the move higher to make a new all time highs or it’s just doing a 3 waves bounce which will end up failing below June peak for another correction to the downside ?
We are launching a new plan covering Stocks & ETFs , so if you’re interested in the future path of Tesla or any other instrument then take this opportunity and try our services 14 days for FREE to learn how to to trade forex, indices, commodities and stocks using our blue boxes and the 3, 7 or 11 swings sequence. You will get access to our 78 instruments updated in 4 different time frames, Live Trading Room and 2 Live Analysis Session done by our Expert Analysts every day, 24-hour chat room support and much more.

Elliottwave-Forecast.com (by EME PROCESSING AND CONSULTING LLC) was founded in 2005 by Eric Morera. Since inception our company has provided tailored Financial Market Services to thousands of clients. ElliottWave-Forecast has built a reputation on accurate technical analysis and a winning attitude. By successfully incorporating the Elliott Wave Theory with Market Correlation, Cycles, Proprietary Pivot System, we provide precise forecasts with up-to-date analysis for 52 instruments including FX majors, Gold, Silver, Copper, Oil, TNX and major Equity Indices. Our clients also have immediate access to our proprietary Actionable Trade Setups, Market Overview, 1 Hour, 4 Hour, Daily & Weekly Wave Counts. Weekend Webinar, Live Screen Sharing Sessions, Daily Technical Videos, Educational Resources, and 24 Hour chat room where they are provided live updates and given answers to their questions.
Unfortunately, this report is not available for the investor type or country you selected.
Browse all ResearchPool reportsReport is subscription only.
Thank you, your report is ready.
Thank you, your report is ready.