​ ZN (10 Year Treasury Note) and SPX
Many traders around the World keep picking the top in Indices and fail to capitalise on the trend which is to the upside. Recently, we did a blog to explain World Indices could see another huge peak around 2020 – 2022, of course there would be corrections in between but they should offer nothing more than a buying opportunity in the sequence of 3, 7 or 11 swings. Advantage of trading with technique is that even when the trend is extreme, you are trading with a defined risk and get a chance to eliminate risk on the trade as the market bounces from extreme areas after 3 swings, 7 swings or 11 swings. In this video we explain the relationship between ZN (10 Year Treasury Note) and SPX.
ZN (10 Year Treasure Note) and SPX Overlay
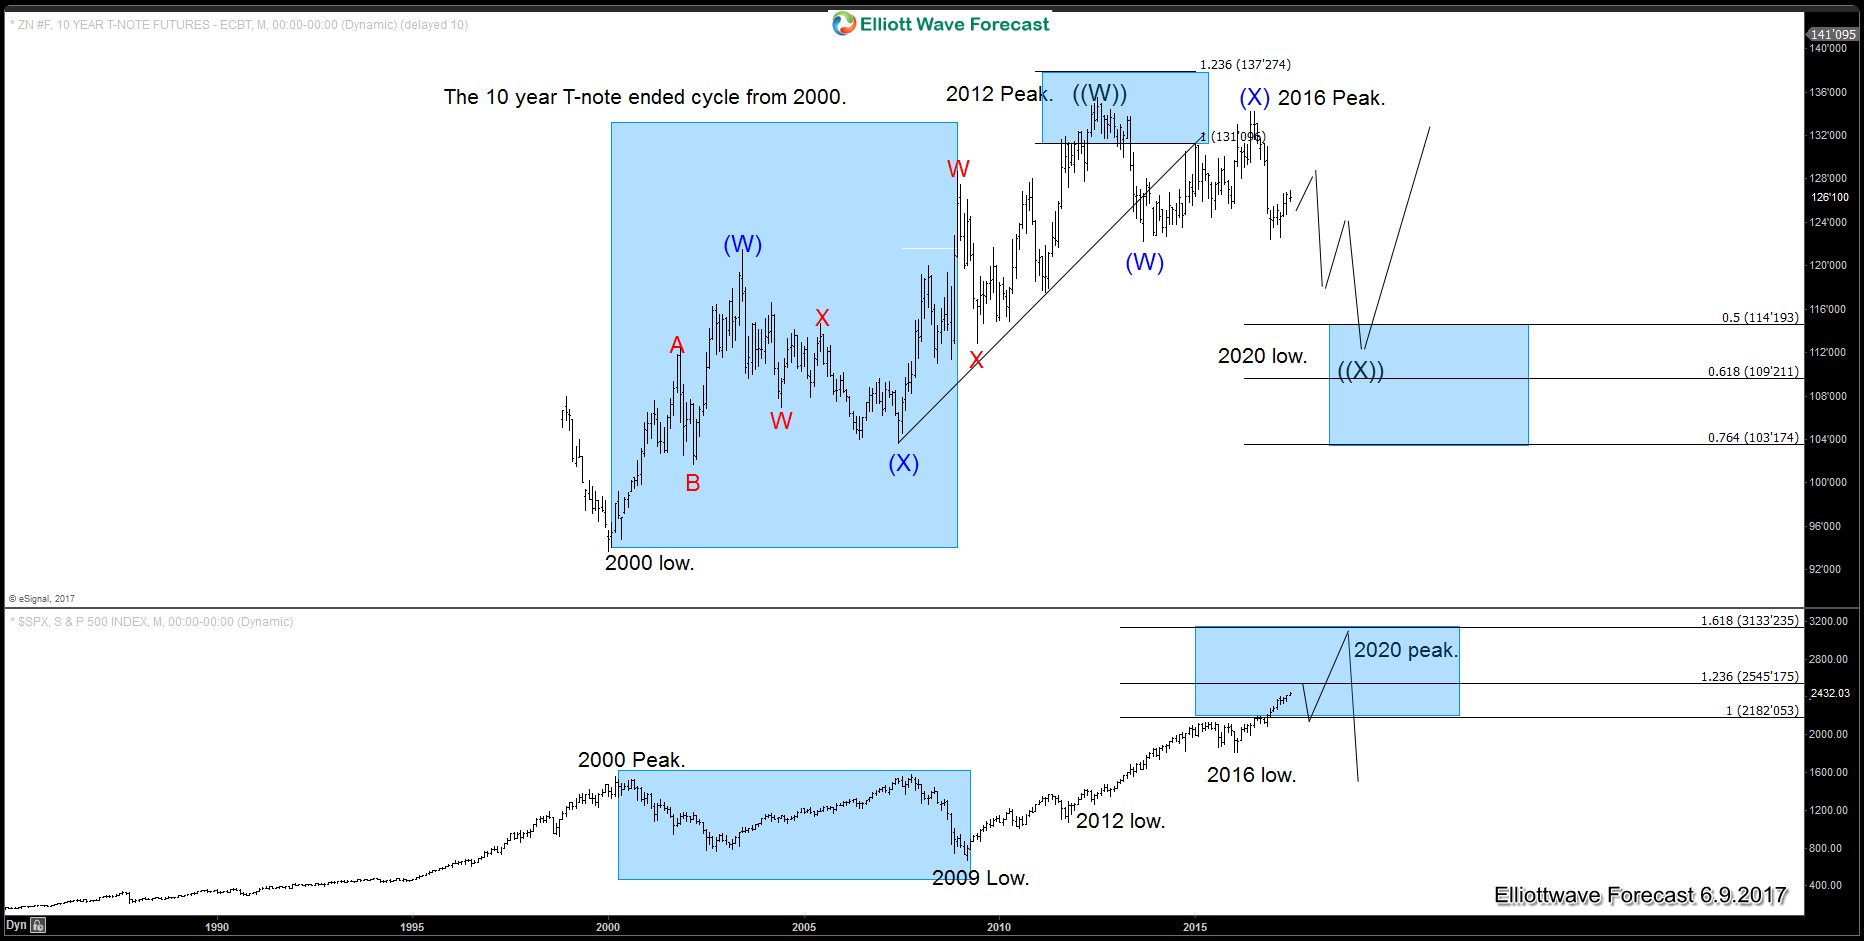
Above chart shows ZN (10 Year Treasury Note) has ended the cycle from 2007 low and most likely from 2000 low as well and as far as bounces fail below 2016 and more importantly below 2012 peak, 10 year note prices can drop towards 117 – 114.19 area to finish correcting 2000 cycle and then turn higher again for another monthly cycle or make a larger 3 waves bounce at least. We can see in the above chart that 10 year note formed a peak in 2012 and dropped and SPX rallied. Then we saw another secondary peak in 10 year note in 2016 which was a low in SPX and caused another rally. While below 2016 peak, 10 year note prices should drop further and that should cause SPX rally to extend and it could reach as high as 3133 area by the year 2020 – 22. Therefore, we don’t like picking the tops in Indices and expect buyers to appear in the dips after 3, 7 or 11 swings. When 10 year note prices reach 117 – 114.19 area, Indices would have a chance to form a huge peak and start a larger pull back and that should be a good time to buy 10 year T-note.
ZN (10 Year Treasury Note) and SPX Video

Elliottwave-Forecast.com (by EME PROCESSING AND CONSULTING LLC) was founded in 2005 by Eric Morera. Since inception our company has provided tailored Financial Market Services to thousands of clients. ElliottWave-Forecast has built a reputation on accurate technical analysis and a winning attitude. By successfully incorporating the Elliott Wave Theory with Market Correlation, Cycles, Proprietary Pivot System, we provide precise forecasts with up-to-date analysis for 52 instruments including FX majors, Gold, Silver, Copper, Oil, TNX and major Equity Indices. Our clients also have immediate access to our proprietary Actionable Trade Setups, Market Overview, 1 Hour, 4 Hour, Daily & Weekly Wave Counts. Weekend Webinar, Live Screen Sharing Sessions, Daily Technical Videos, Educational Resources, and 24 Hour chat room where they are provided live updates and given answers to their questions.
Unfortunately, this report is not available for the investor type or country you selected.
Browse all ResearchPool reportsReport is subscription only.
Thank you, your report is ready.
Thank you, your report is ready.